
Docs › Build reports
The report builder
The report builder is where you turn spreadsheets into a dashboard: you lay visuals out on pages, feed them fields from your data, filter them, theme them, print them and save the result. This guide covers the builder's layout and every action you can take in it; the settings of each individual visual are in Visual options.
Where you meet the builder#
The same builder opens in three places. What it lets you do depends on where you opened it and on your workspace's plan.
| Where | How you get there | What it is for |
|---|---|---|
| Try it | The public "Try it for free" page. No account. | Trying the product with your own file. Everything runs in your browser and nothing is uploaded. |
| New report on the Free plan | Saved reports > New report in a workspace on the Free plan. | Building a report from up to 5 spreadsheets. Nothing is saved. |
| A saved report | Opening a report from Saved reports, or New report in a workspace on Mini, Plus or Ultimate. | Building, saving and reopening reports in your workspace. See Saved reports. |
The differences are summed up in Try it vs. a signed-in builder near the end of this page.
The layout#
- Toolbar across the top: theme, report name, saved state, view switch, undo / history / redo, help, print, export and save.
- Page tabs under the toolbar: one tab per page, plus + Page.
- Canvas in the middle: the open page and its visuals.
- Visual pane on the right, with its tabs: Visual (the settings of the selected visual), Filters and Bookmarks; or the report's history.
- Rail at the far right: the Data, Visuals and (with two or more datasets) Connections panes.
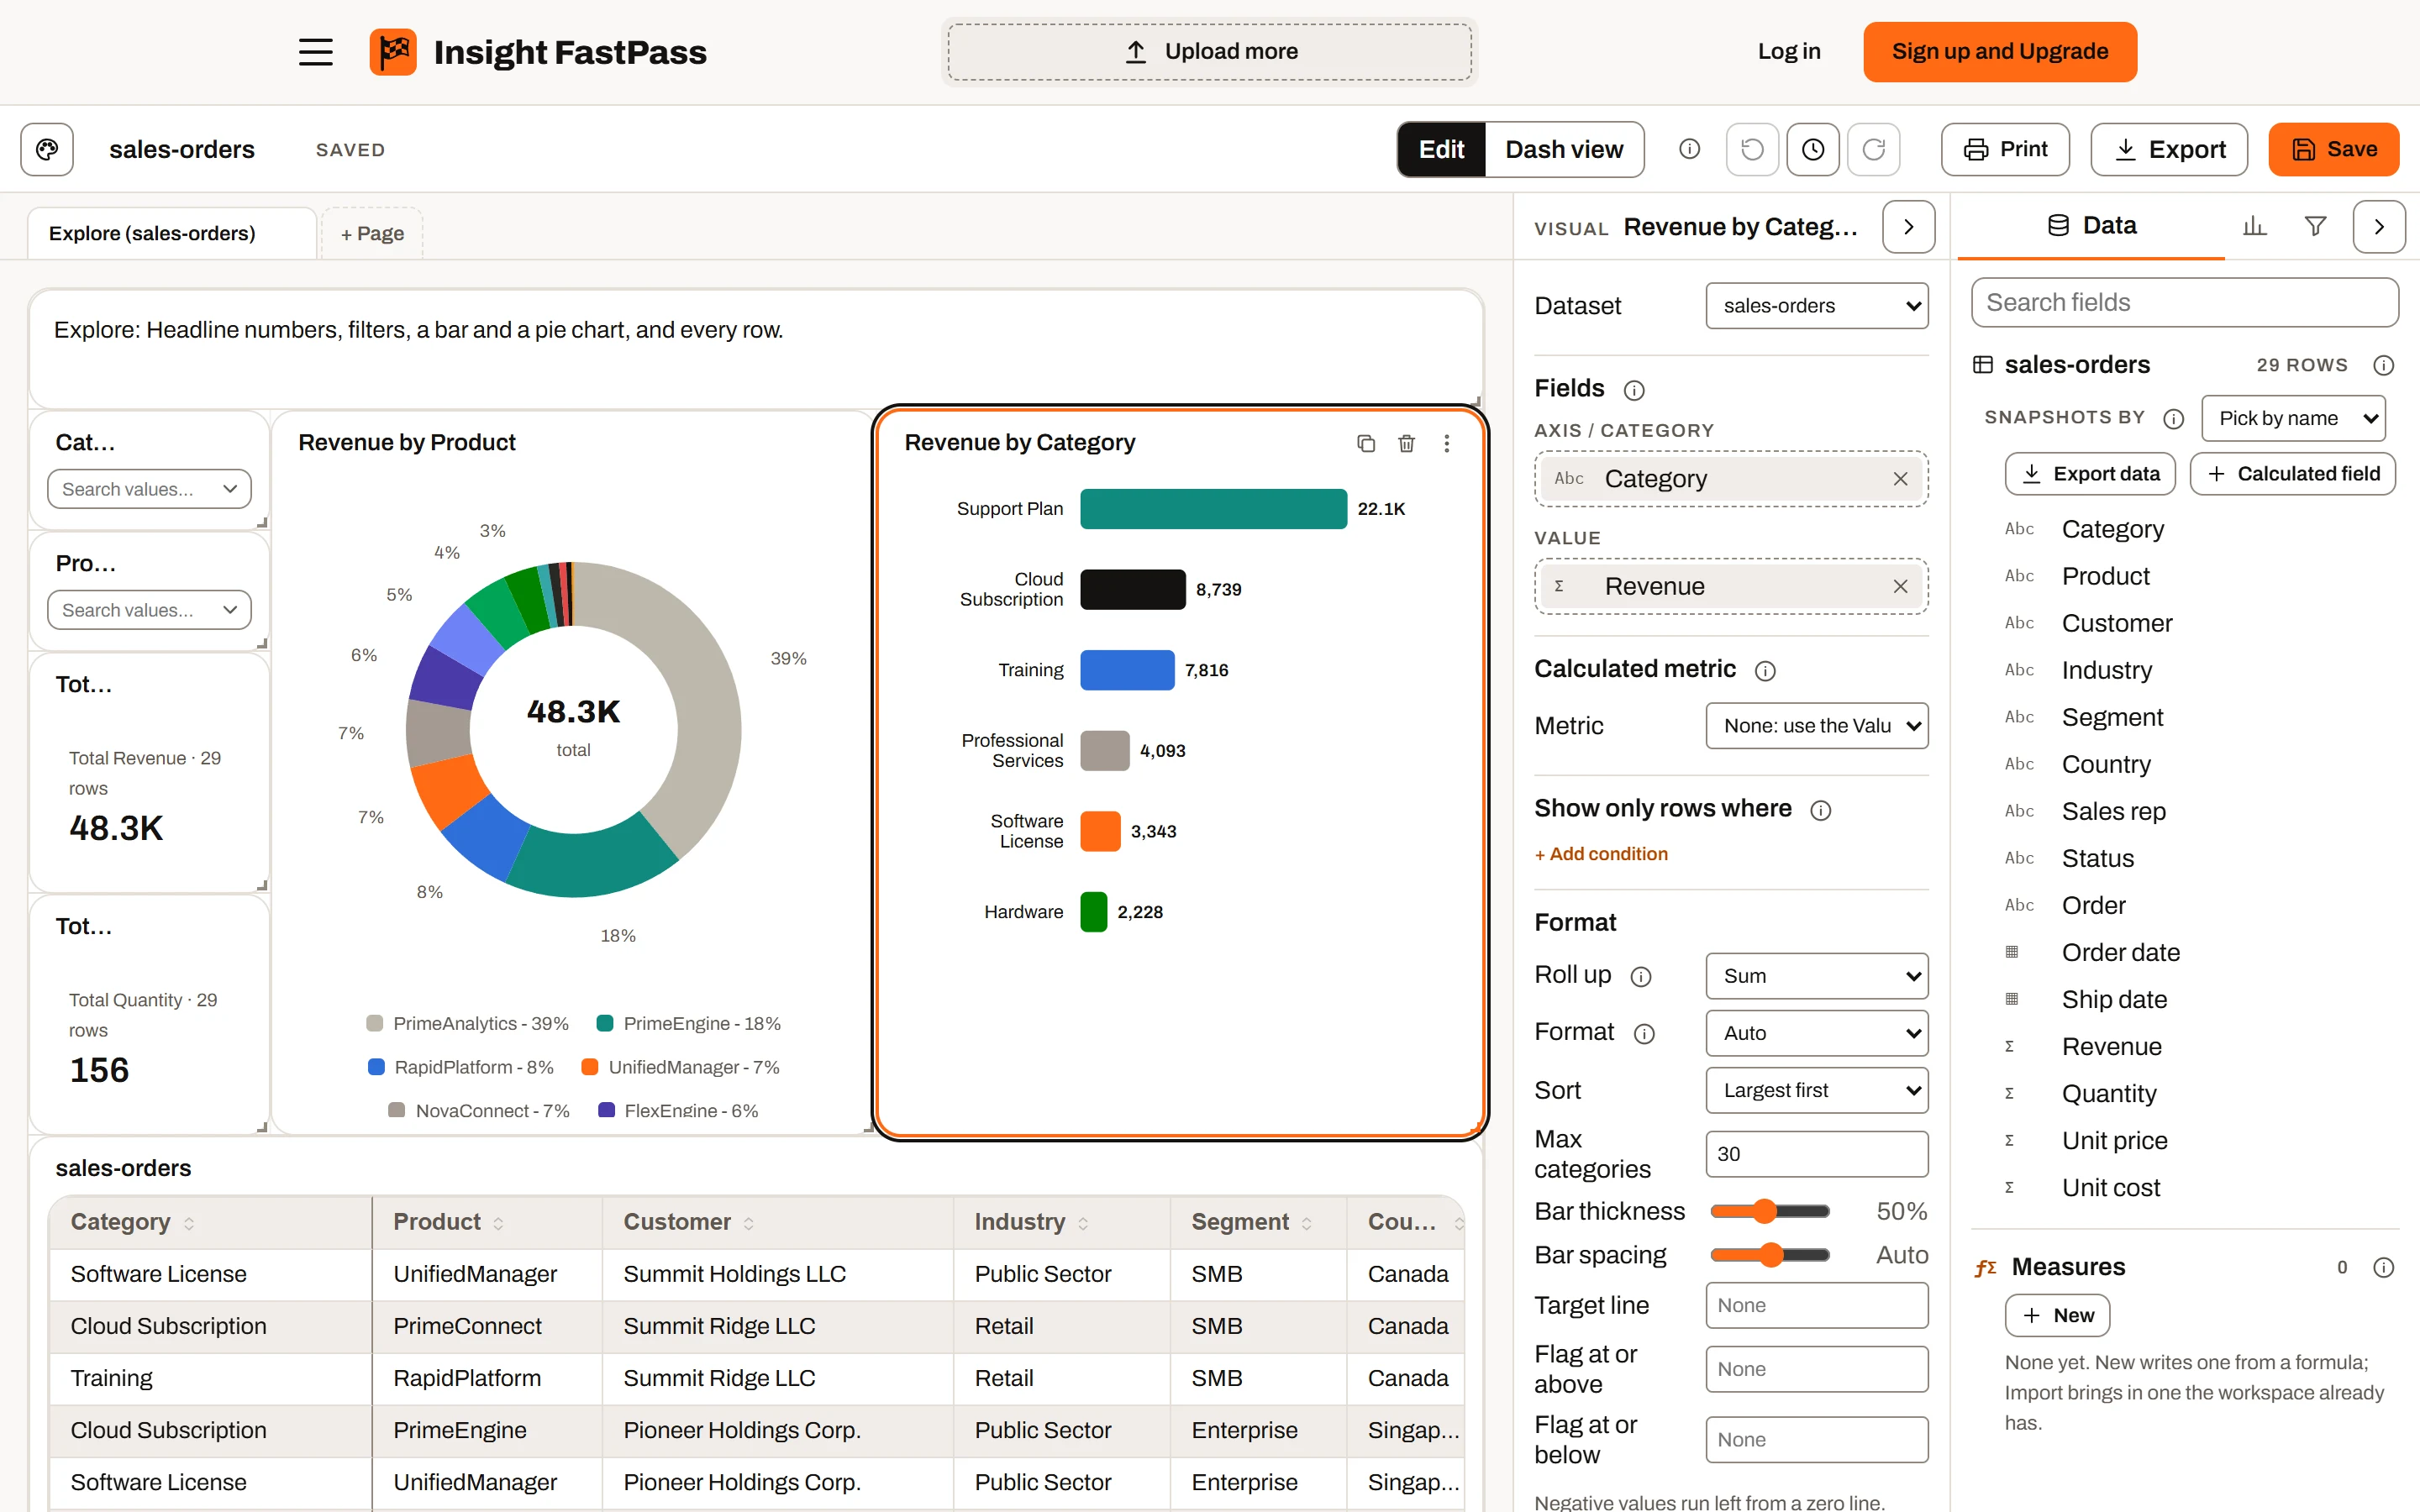
The report builder in Edit mode, on the sample sales orders.
The Visual pane and the rail are shown only in Edit mode. In Dash view the canvas takes the whole width, the way people who only view the report see it.
Resizing and folding the side panes#
- Drag the left edge of the Visual pane or of the rail to resize it. The rail can be 220 to 560 pixels wide (280 by default), the Visual pane 200 to 520 pixels (260 by default).
- With the edge focused, the arrow keys move it 16 pixels. Double-click the edge to go back to the default width.
- Your widths are remembered in this browser.
- The arrow button at the top of each pane folds it. A folded Visual pane becomes a narrow strip labelled with its open tab (Visual, Filters, Bookmarks) or History; a folded rail shows only its tab icons. Click a tab or the strip to open it again.
- On a window under 900 pixels wide the side panes float over the canvas. Below about 360 pixels, only the open rail tab keeps its label; below about 280 pixels, only the open Visual pane tab does.
The toolbar#

The toolbar in Edit mode.
| Control | What it does | When it shows |
|---|---|---|
| Paint palette (Report theme) | Opens the theme picker. See Themes. | Edit mode |
| Report name | Click and type to rename the report. Enter finishes. A run of typing is one undo step. | Always (editable only in Edit mode) |
| Saved / Unsaved | Whether there are changes since the last save, or since the report was opened. | Edit mode |
| Locked / Unlocked | The layout lock. Locked keeps visuals in place in Dash view; Unlocked lets you drag and resize them there without switching to Edit. A toast confirms ("Layout locked" / "Layout unlocked: drag visuals to rearrange"). Switching to Dash view always locks it again. | Dash view, for people who can edit |
| Edit / Dash view / Full screen | Switches between building and viewing. Dash view hides the panes, clears the selection and locks the layout. Full screen is Dash view with the toolbar hidden and the report filling the screen; press Esc, or move the pointer to the top of the screen and click the X that drops down, to leave it (back to Dash view). | Everyone; Edit only for people who can edit |
| Undo | Undoes the last change (Ctrl+Z). Greyed out when there is nothing to undo. | Edit mode |
| History (clock) | Shows the list of changes in place of the Visual pane. See History, undo and redo. | Edit mode |
| Redo | Redoes the last undone change (Ctrl+Y). | Edit mode |
| Help | Opens the builder tours. See In-app tutorials. | Always |
| Opens the print preview. See Printing. | Always, on every plan | |
| Export | A menu: Download definition (.json), Download report (.ifpr), Import…. See Exporting and importing. | Plans that save reports, for editors and viewers (not guests) |
| Import data | For a viewer of a report whose rows aren't stored: loads one of its datasets again from a newer file with the same columns ("A file with the same columns."). Replaces Export for that viewer. | Viewers, when the report reads datasets from files |
| Save all edits | Saves the grid edits of every dataset that has some, in turn, to wherever each one writes ("Saving edits…" while it runs, then "Saved the edits of n datasets"). It doesn't save the report, and Save doesn't send edits. See Saving grid edits. | Plus and Ultimate, while a stored dataset has edits that can be saved (in Dash view too) |
| Save | Saves the report. Hover or focus shows the shortcut (Ctrl+S, or ⌘S on a Mac). | Plans that save reports, for people who can edit |
| Sign up for Save and Export | Takes the place of Export and Save. Opens the workspace's Upgrade page in a new tab. | Free plan |
Who sees what. Viewers in the workspace get Export (or Import data) and Print, plus Dash view and Full screen, but no lock, no Edit, no Save and no Import…. Someone viewing a report shared with them by email, or opened from a public link, gets Print (and Dash view / Full screen) only. See Sharing.
Saving#
- A report in your workspace (Mini, Plus, Ultimate): saved to the workspace. The first save of a new report creates it in the folder it was started in ("Report saved to your account"); later saves read "Report saved". What is saved is the report's definition: pages, visuals, filters, theme, connections, column settings and snapshot choices. On Mini (and on Plus for datasets past the 10 whose rows are stored) the rows are not saved, so the toast adds "Reopen it with spreadsheets whose column headers match", and an info tip beside Save says the same. See Saved reports.
- Try it: no Save or Export; the toolbar offers Sign up for Save and Export in their place.
- Free plan: no Save. Ctrl+S shows "Sign up to save reports" and does not open the browser's Save page dialog.
Ctrl+S (Cmd+S) saves wherever the Save button is shown, even while typing in a box. Holding the keys, or pressing them during a save, does not save twice.
| Message | What happened |
|---|---|
| "Name is editing this report" | Another person was saving the same report at that moment. Try again shortly. |
| "Someone saved this report since you opened it. Reopen it to see their changes." | The report changed after you opened it (saved or renamed by someone else). |
| "Your plan doesn't include saving reports" | The plan refused the save, including when the workspace already holds as many reports as its plan allows. |
| "You don't have edit access to this report" | Your access to the report or its folder doesn't include editing. |
Exporting and importing#
| Entry | What you get | Plan |
|---|---|---|
| Download definition (.json) | <report name>.report.json: "Pages, visuals and filters. No data." | Mini, Plus, Ultimate |
| Download report (.ifpr) | <report name>.ifpr: "The report, its data and edits, in one file the desktop app opens too." | Plus, Ultimate |
| Import… | "Open an .ifpr, a definition or a package file." Editors only. It loads the file into the report open now; to keep a file as a new saved report, use Upload report on the Reports page, which also takes an SSRS report (.rdl) and a Power BI template (.pbit) (see Saved reports and Import from Power BI). | Mini, Plus, Ultimate |
An .ifpr is the same file the desktop app saves, so a report moves between the website and the desktop app either way. Import… also still opens the older .package.json packages.
Import… replaces the report on screen with the file's; an .ifpr or a package replaces the rows too. History starts again, and the report is marked Unsaved. "Opening report…" shows while it reads; then "Opened name". A wrong file shows "file is not a report file."; one from a newer version, "file was saved by a newer version. Update and try again."
- In a saved workspace report, saving after an import overwrites the saved report.
- A visual that reads a dataset not loaded shows "The sheet … is not loaded".
To export rows to Excel, use Export data in the Data pane. To get a PDF, print and choose your browser's "Save as PDF" (in the desktop app, your system's print dialog).
Themes#
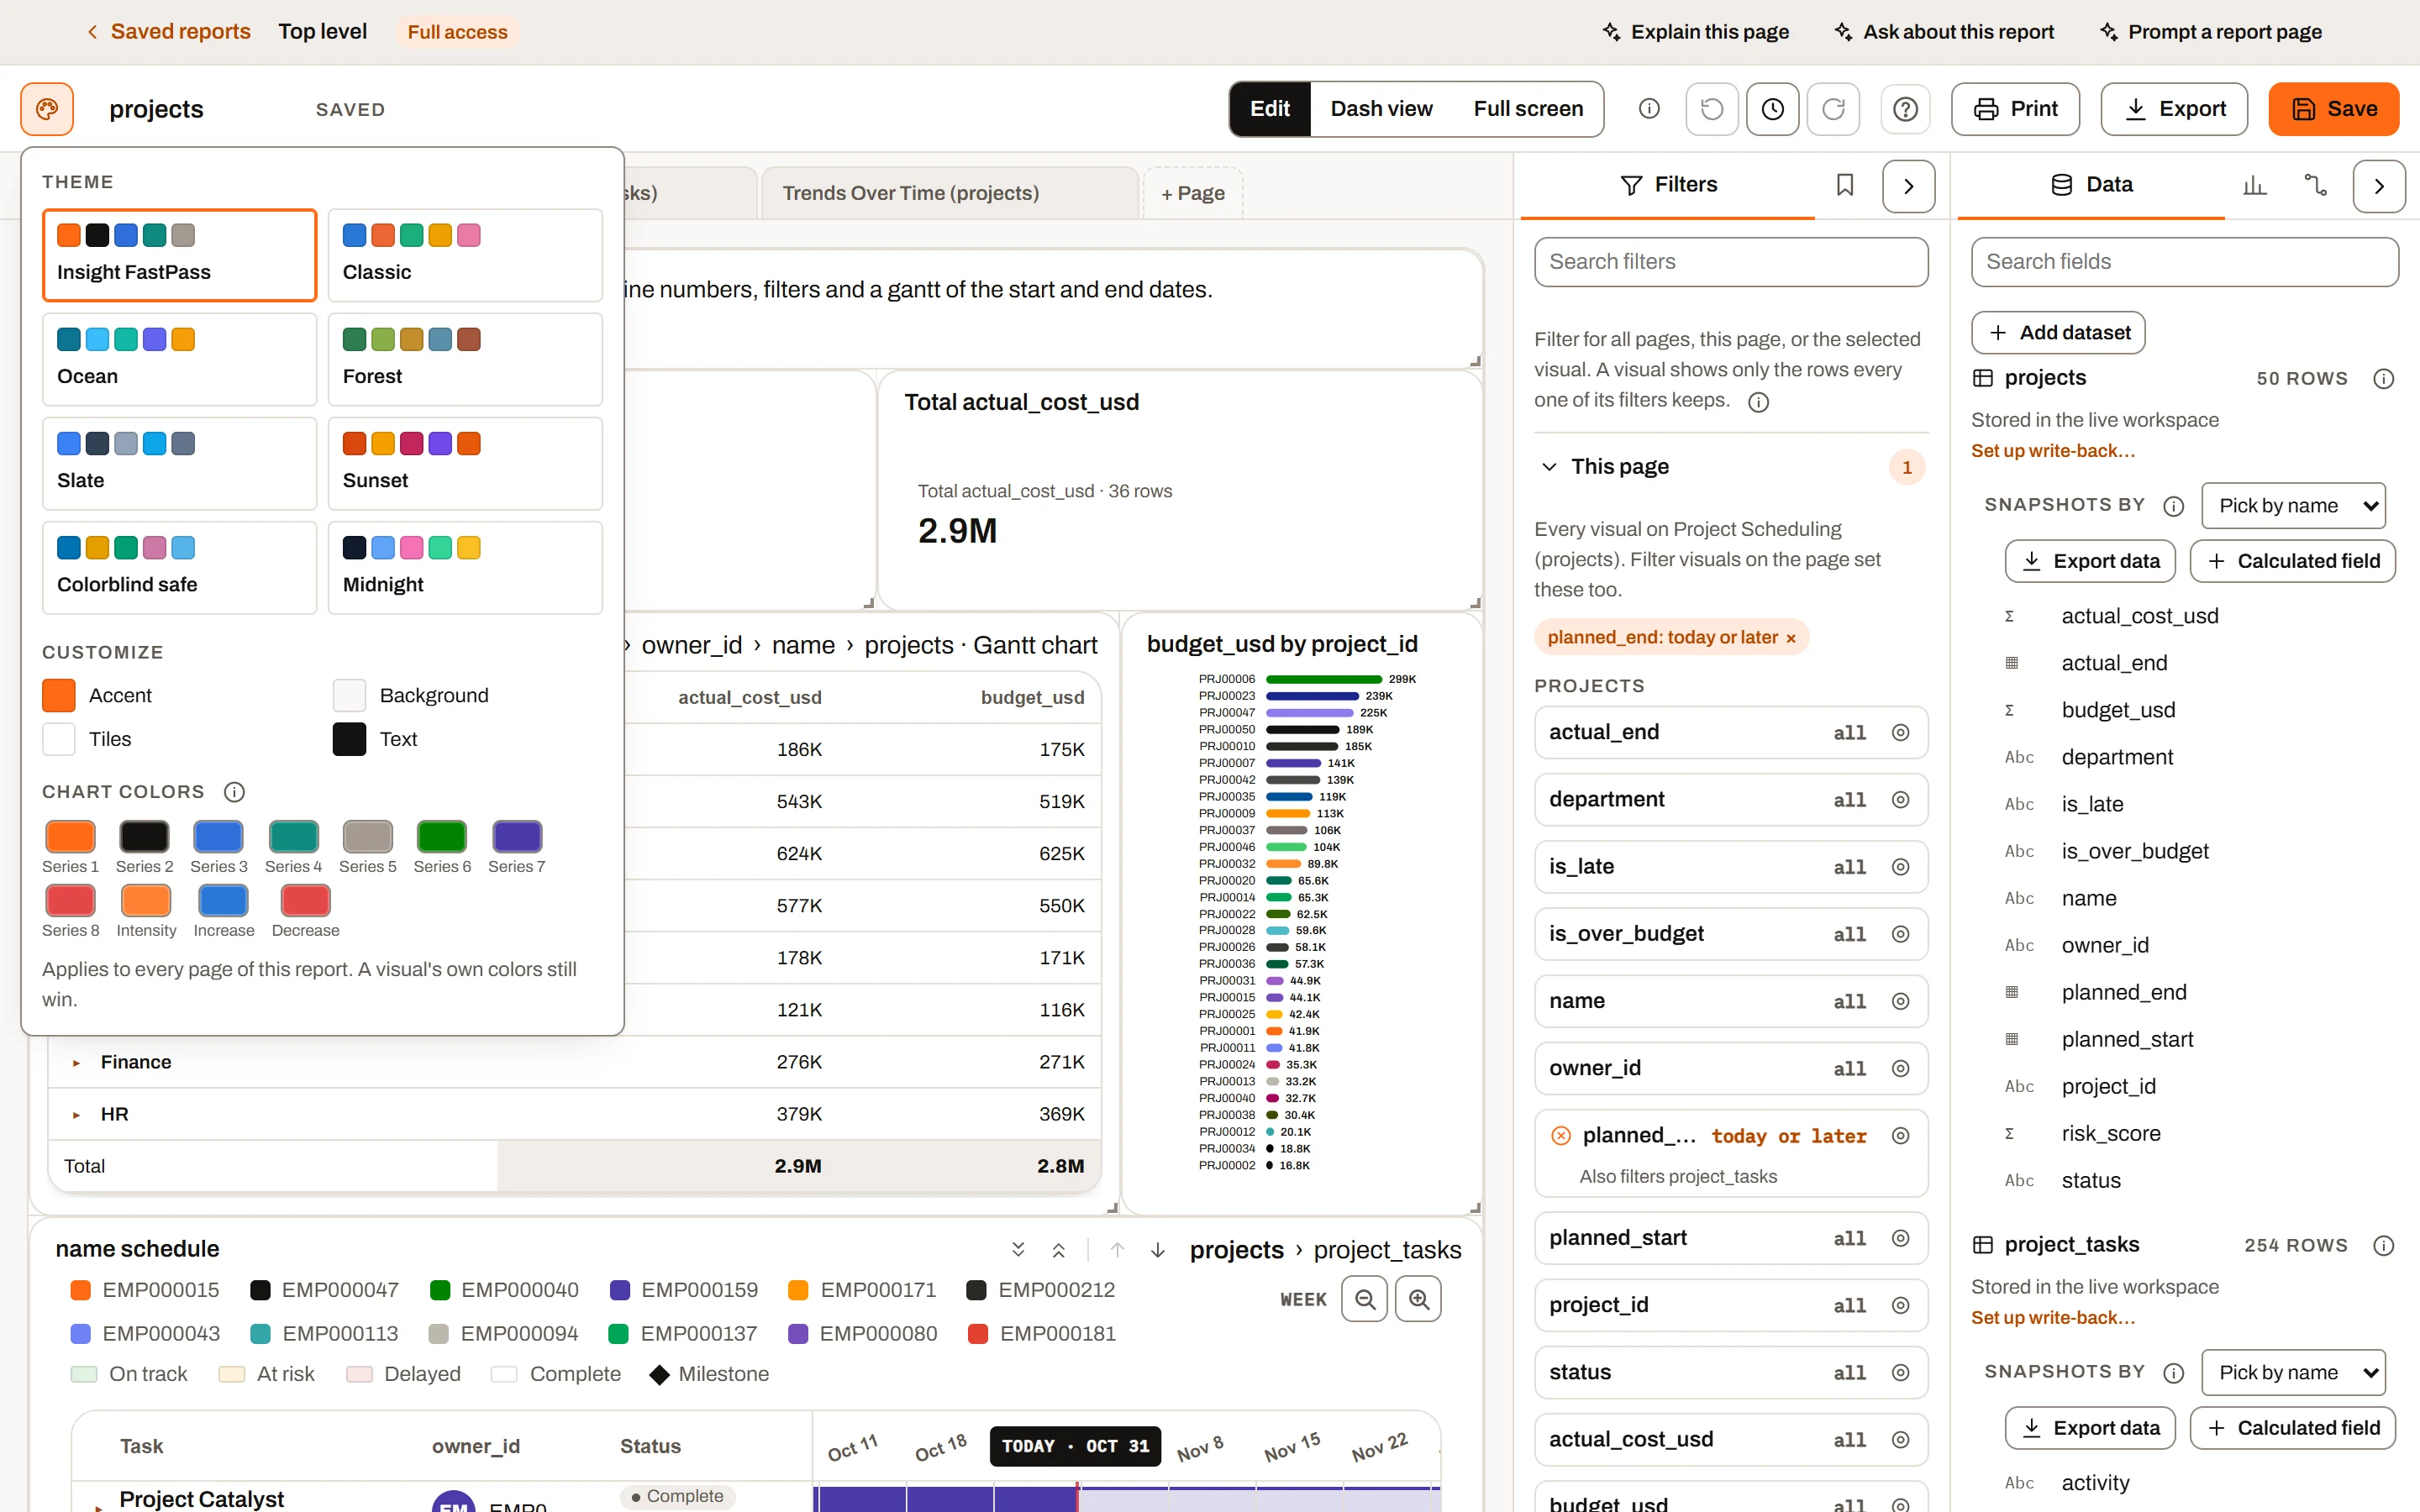
The theme picker: presets, custom colours and the chart colours.
A theme sets the colours of the report's pages: accent, page background, tiles, text and chart colours. The builder's own chrome keeps the site's look.
Click the paint palette (Edit mode) to open Theme:
- Presets (hover for the description):
Preset Description Insight FastPass The site colours: orange and black on white, following light and dark mode. Classic The chart kit's validated palette, blue first. Safe for most colour vision. Ocean Teals and blues with a warm accent for contrast. Forest Greens and earth tones. Slate Corporate greys with a single blue to lead. Sunset Warm reds, oranges and purples. Colorblind safe The Okabe-Ito palette, told apart with every common colour vision deficiency. Midnight Bright colours on a dark navy page, whatever the site's mode. - Customize: Accent, Background, Tiles, Text. Changing one marks the theme "Custom colors"; lines, bands and muted text are worked out again from background, tiles and text.
- Chart colors: eight series colours, the sequential ramp (pick one base colour; the ramp is regenerated) and the two diverging colours.
- Use site colors goes back to the default.
How it works: the theme applies to every page, is saved and exported with the report (older reports open with the site theme); a preset is one undo step and a colour drag is merged into one; a theme without its own background follows light/dark mode; a visual's own colours still win ("A visual's own colors still win."); colours are copied into the report, so later changes to a preset don't affect existing reports.
Pages#

Page tabs, with a second page added.
| Task | How |
|---|---|
| Switch pages | Click a tab (or focus it and press Enter). Both modes. Switching clears the selection and marks the report changed, because the open page is saved. |
| Rename | In Edit mode, type in the tab's name; Enter or clicking away saves. Tab / Shift+Tab save and jump to the next / previous tab's name. Tabs grow to fit; the strip scrolls sideways. |
| Reorder | In Edit mode, drag a tab sideways. One undo step. |
| Delete | In Edit mode, × on the tab, confirm "Delete page "name"?". The last page can't be deleted ("A report needs at least one page"). Undo restores it. |
| Add | In Edit mode, + Page, then blank or template. The new page opens. |
| Hide | In Edit mode, the eye button on the tab, or right-click the tab, Hide page. A hidden page has no tab in Dash view and is never printed; it is reached by a drill-through or a button. See Hidden pages. |
There is no Duplicate page. To copy a page: open it, Ctrl+A, Ctrl+C, add a blank page, Ctrl+V; the visuals land in the same places.
Clear visual filter appears at the right of the tab strip, in both modes, while a click in a visual filters the page. Its tooltip names the source visual. Clear drill filters appears beside it while the open page has values a drill-through set. See Filters and interactions.
Adding a page: blank or from a template#
+ Page opens Add a page ("Start blank, or from a dashboard template filled in from your data."):
- Blank page ("An empty page to build on from the Visuals pane."). Named Page 2, Page 3…
- Suggested for your data: the best-fitting dashboard templates (Plus, Ultimate).
- Basic: your plan's basic pages; the best one first, tagged Default and focused (Enter picks it), then the rest, best-filled first.
- Every dashboard template your plan offers, by category.
Controls: All / Construction / Manufacturing narrows dashboards by industry ("Both" templates show under either; hidden without dashboards). With several datasets, Build from picks the dataset ("Best match for each template" by default).
Each card shows the name, industry (or Default), what it helps you see, a fit meter and "Matches columns + n more" (or "No matching fields: tiles start on the first fields of the sheet"). With no data only the blank page is offered. When the plan leaves templates out, a line says what other plans add, with See plans (the Upgrade page, or the pricing page on Try it).
Reviewing the fields ("Template: fields"):
- Not found in your data: each unmatched field, the visuals it breaks ("Breaks …") or "Optional: … still shows without it". Pick a column, or keep Hide that visual / those n visuals ticked. Unfillable calculated values are grouped under Calculated values; set their inputs on the visual afterwards.
- Picked from your data: matched fields, who uses them and the column; change it (or None) and every visual reading it follows.
- Footer: visuals left out, Back, Add page (one undo step).
A template page is named "Template (dataset)", e.g. "Explore (Orders)". Its visuals are ordinary visuals.
How matching works. Templates read roles ("planned finish", "retainage"), not exact headers. Headers are compared with each role's known names, allowing abbreviations (qty, amt, cust, wo, po, pct, %), plurals, word order and spellings (labour/labor). A header only fills a role whose kind (number, date, text) suits it, and at most one role per template.
What a new report opens on#
Each sheet gets one page from its default basic page: Project Scheduling if the sheet fills every field it needs (start and end dates and the rest; progress may be missing), otherwise Explore. On Free and Try it it is always Explore. These pages are built strictly: visuals the sheet can't fill are left out. In a saved report or the desktop app, only the datasets whose Create a page for this dataset is on in New report get a page; with none on, the report starts with one empty page. A sheet added later gets its own page when Create a page for this dataset is on in Add dataset (it starts at the report's Pages for new datasets), unless a page already shows it.
The page templates#
Basic pages:
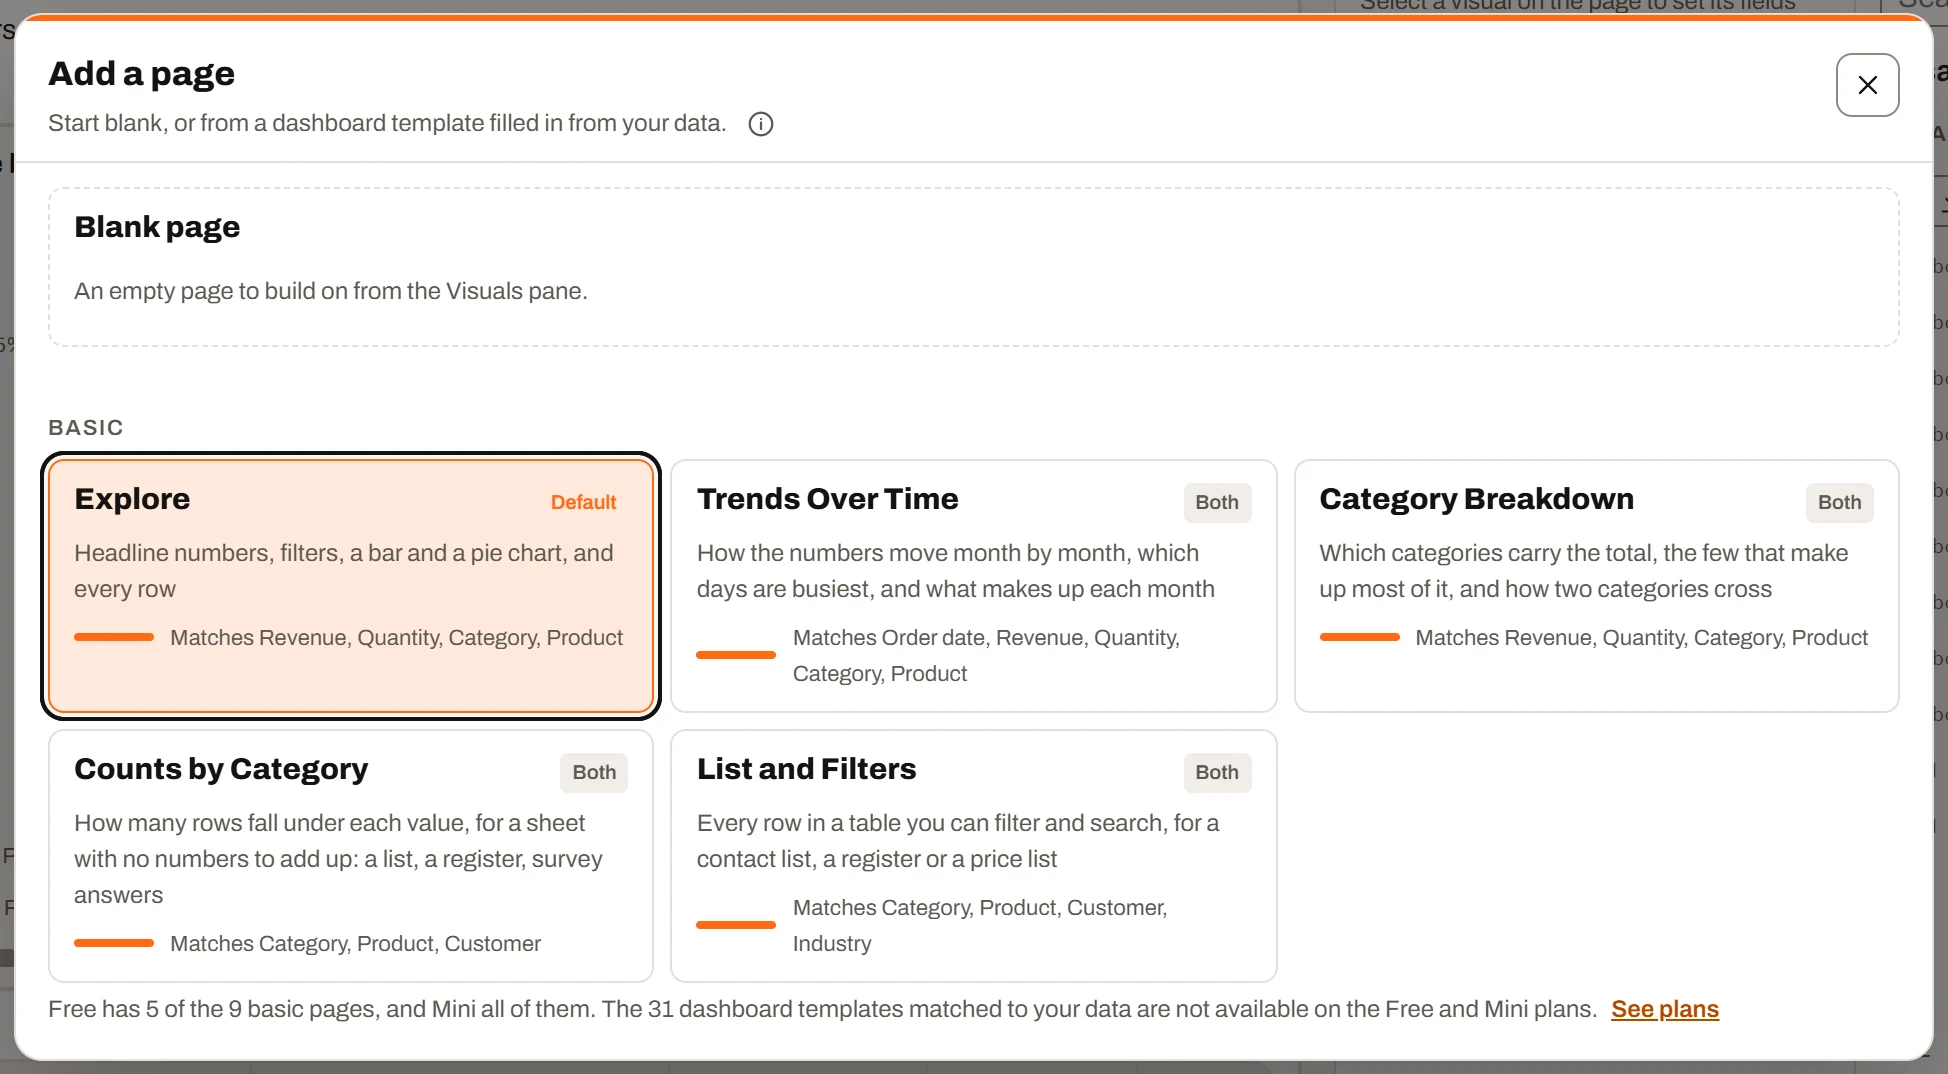
Add a page: a blank page, or a template filled in from your data.
| Page | Good for | What it shows | Plans |
|---|---|---|---|
| Explore | Any sheet with numbers and categories | Headline numbers, filters, a bar and a pie chart, and every row. A sheet with no numbers gets just every row, with a search box above each column | All |
| Trends Over Time | A date and a number: sales log, timesheet, expenses | How the numbers move month by month, which days are busiest, and what makes up each month | All |
| Category Breakdown | A number and one or two categories | Which categories carry the total, the few that make up most of it, and how two categories cross | All |
| Counts by Category | A sheet with no numbers | How many rows fall under each value | All |
| List and Filters | A contact list, register, price list | Every row in a table you can filter and search | All |
| Project Scheduling | Start and end dates | Every row beside a bar chart, headline numbers, filters and a gantt | Mini, Plus, Ultimate |
| Task Tracker | A to-do or issue list | Items by status, who holds them, and what comes due each week | Mini, Plus, Ultimate |
| Plan vs Actual | Two numbers to compare | Which categories run over or under, and whether one follows the other | Mini, Plus, Ultimate |
| Spread and Outliers | A number whose spread matters | Its usual range, the categories that run high or low, and the rows that stand out | Mini, Plus, Ultimate |
Task Tracker and Plan vs Actual look for columns by name (Status, Owner, Priority, Due date; Actual, Plan). Task Tracker drops its due-date visuals without a date column.
Dashboard templates (31; Plus and Ultimate):
| Category | Template | Industry | What it helps you see |
|---|---|---|---|
| Operations | Project Health | Construction | Which projects are behind schedule, upcoming deadlines, projects needing intervention |
| Operations | Production Performance | Manufacturing | Output versus plan, delayed work orders, production bottlenecks |
| Operations | Daily Action Center | Both | Overdue actions, unresolved critical issues, work awaiting ownership |
| Sales | Bid Pipeline and Win Rate | Construction | Bid conversion, upcoming submissions, successful project types, reasons for losses |
| Sales | Quote Conversion | Manufacturing | Quote-to-order conversion, sales cycle length, aging quotes, strongest customer segments |
| Sales | Sales and Backlog | Both | Incoming work trends, remaining committed work, customer concentration, future workload |
| Cost Analysis | Project Budget vs. Actual | Construction | Cost overruns, exposure from commitments, forecast final cost, categories driving variance |
| Cost Analysis | Job and Unit Cost | Manufacturing | Actual unit cost, estimate accuracy, expensive jobs, main cost drivers |
| Cost Analysis | Profitability by Job or Customer | Both | Highest- and lowest-margin work, unprofitable customers, margin trends |
| Cost Analysis | Estimate Accuracy | Both | Recurring underestimation, quantity versus rate variances, assumptions needing revision |
| Scheduling and Capacity | Crew and Project Schedule | Construction | Scheduling conflicts, staffing shortages, activities threatening project deadlines |
| Scheduling and Capacity | Work-Center Capacity | Manufacturing | Overloaded work centers, unused capacity, scheduling bottlenecks |
| Finance and Cash Flow | Accounts Receivable Aging | Both | Overdue balances, collection priorities, customers driving cash delays |
| Finance and Cash Flow | Cash Flow Forecast | Both | Expected cash shortages, timing mismatches, upcoming funding needs |
| Finance and Cash Flow | Billing and Retainage | Construction | Under/overbilling, uncollected billings, cash tied up in retainage |
| Purchasing and Suppliers | Procurement and Delivery Risk | Both | Late purchases, material readiness risks, supplier delivery reliability |
| Purchasing and Suppliers | Purchase Price Variance | Manufacturing | Price increases, supplier price differences, materials driving purchasing overruns |
| Inventory and Materials | Inventory Health | Manufacturing | Stockout risks, excess stock, slow-moving inventory, inventory value |
| Inventory and Materials | Project Material Readiness | Construction | Tasks lacking materials, excess site inventory, opportunities to transfer stock |
| Quality and Rework | Yield, Scrap, and Rework | Manufacturing | Yield losses, recurring defects, machines or products driving quality costs |
| Quality and Rework | Inspections and Punch Lists | Construction | Unresolved deficiencies, repeat failures, closeout delays, costly rework |
| Workforce and Productivity | Crew Productivity | Construction | Labor efficiency, tasks consuming excess hours, overtime dependence |
| Workforce and Productivity | Labor Efficiency | Manufacturing | Actual versus standard labor use, productivity trends, staffing pressure |
| Equipment and Maintenance | Fleet Utilization and Cost | Construction | Underused equipment, avoidable rental costs, expensive assets |
| Equipment and Maintenance | Machine Reliability | Manufacturing | Downtime drivers, recurring failures, repair time, overdue preventive maintenance |
| Safety and Compliance | Safety and Corrective Actions | Both | Incident trends, recurring hazards, overdue actions, exposure-adjusted incident rates |
| Customer Service and Delivery | On-Time, In-Full Delivery | Manufacturing | Delivery reliability, partial shipments, late-order patterns |
| Customer Service and Delivery | Client Issues and Warranty | Construction | Slow responses, unresolved warranty work, recurring client issues |
| Change Management | Change Order Exposure | Construction | Unapproved work exposure, approval delays, changes affecting margin and schedule |
| Change Management | Engineering Change Impact | Manufacturing | Orders affected by revisions, implementation delays, inventory at risk |
| Executive Performance | Business Performance Overview | Both | Overall business health, performance against targets, units requiring attention |
A dashboard page has a heading, up to 4 drop-down filters, up to 6 KPI cards (many with a monthly trend and change; several are calculated rates such as win rate or on-time-in-full), then charts and tables. On a sheet with two or more snapshots, history visuals are added and KPIs trend across snapshots (see Snapshots and versions).
Plan availability: Try it: 2 basic pages (Explore and Category Breakdown). Free: 5 basic pages. Mini: all 9 basic pages. Plus and Ultimate: 9 basic + 31 dashboards. Pages already in a report are never removed.
The rail#
Three panes, one visible at a time: Data, Visuals, and Connections (only with two or more datasets; falls back to Data if the count drops to one). The rail opens on Data. Filters and Bookmarks are tabs of the Visual pane.
The Visuals pane#
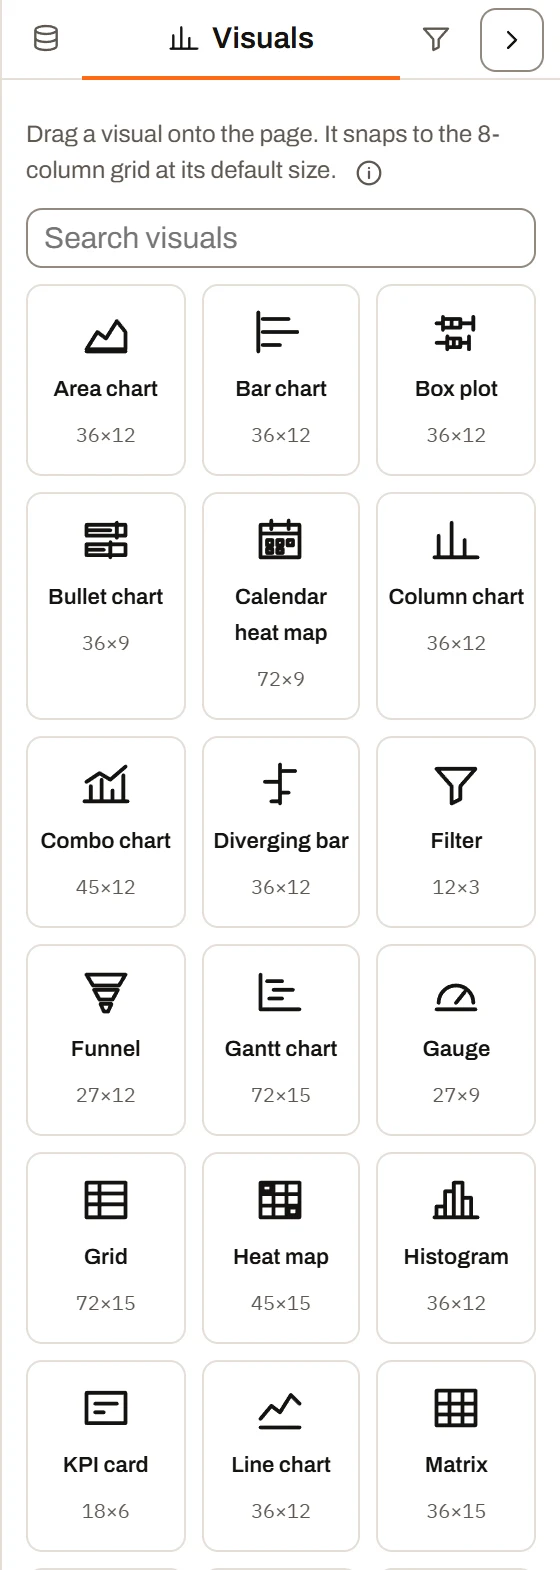
The Visuals pane.
Cards for the visual types your plan offers, sorted alphabetically, each with icon, name and default size in grid cells (36x12 is half the page wide).
Add a visual by:
- Dragging a card onto the page; a dashed ghost shows where and how big it lands.
- Double-clicking a card, or focusing it and pressing Enter: placed at default size in the first open space (left to right, then down).
- Pasting copied visuals (see Copy, cut, paste and duplicate).
Search visuals narrows the cards; Clear or Escape empties it ("No visuals match "…".").
A new visual is pre-filled from your first dataset, selected, and the rail switches to Data. Its title follows its fields ("Revenue by Region", "Count by Status") until you type your own. A dropped visual takes its default size or the largest that fits down to the type's minimum; if even that doesn't fit, it goes to the nearest open space ("Placed in the nearest open space").
See Visual types.
Plan availability: Free and Try it: 10 core types (KPI card, Bar chart, Column chart, Pie chart, Grid, Filter, Text, Image, Shape, Button). Mini, Plus and Ultimate: all 33.
The Data pane#
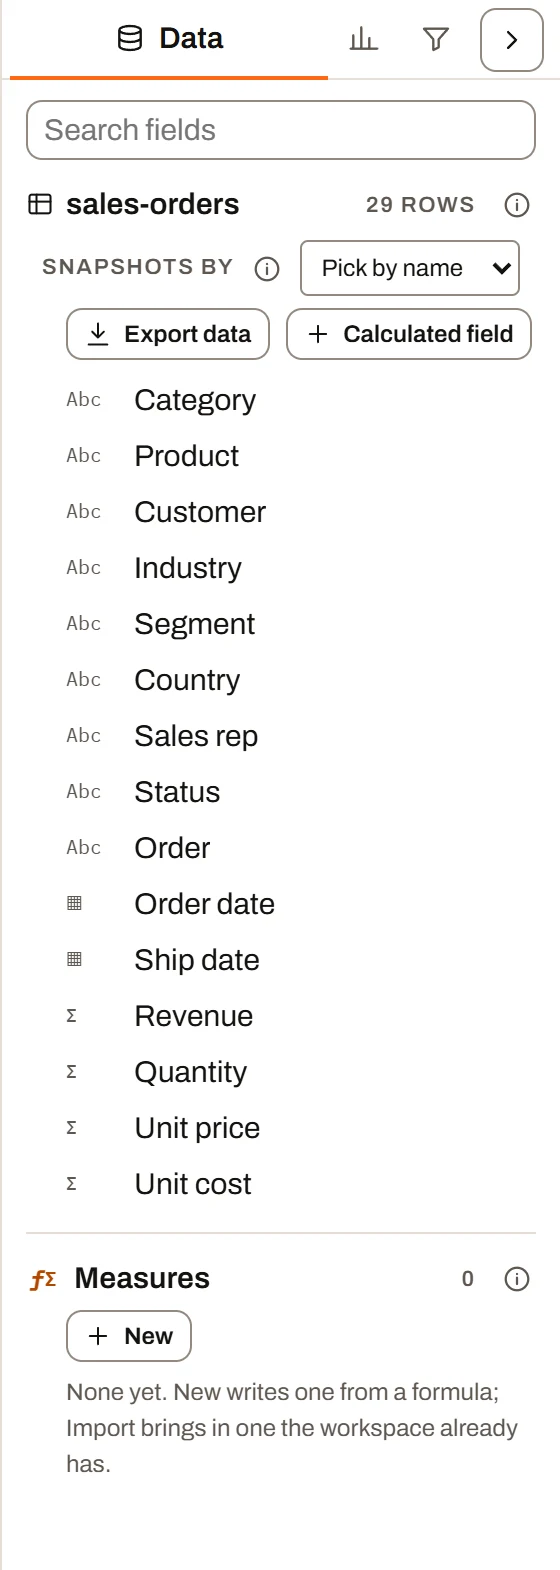
The Data pane, with the sample sales orders loaded.
Every loaded dataset, then Summary Calculations. Search fields and Add dataset stay at the top; the search narrows the lists ("No fields match."). Clicking a field, a calculated field or a Summary Calculation opens its panel at the top of the Visual pane (expanding the pane if it is collapsed), above the selected visual's settings; only one is open at a time.
Each dataset shows its name (hover for the file), row count, and:
- A lightning sign on a live dataset, and a replay sign beside it on a replay dataset, with the block described in Live and replay datasets.
- Field types: Σ number you can total, ▦ date, Abc text; ƒ marks a calculated field.
- Snapshots by / Load for snapshot datasets (Ultimate). See Snapshots and versions.
- Export data (where the plan allows): an Excel
.xlsxwith renamed headers and grid edits ("Building…", then "Exported name"). - Calculated field. See Formulas.
- n edits after grid edits, with Save changes (Plus and Ultimate, when the dataset can take them) and Revert edits (confirmed: "Throw away n edits to "dataset"?", then "Edits reverted"). See Saving grid edits.
- Set up write-back…: opens the dataset's write-back settings in a dialog, "Write-back: dataset" (the owner, admins and anyone with edit access to the dataset, on Plus and Ultimate, while editing a workspace report). See Write-back.
Using a field:
- Drag onto a visual: a number becomes the value, anything else the category, with rules for second values, gantt dates and grid columns.
- Drag into a well in the Visual pane. Wells show acceptance while dragging and refuse the wrong kind ("Value takes a number field").
- Click (or Enter) to open the field's panel: its name, alias, type and format, or a calculation's formula.
- Double-click (or Ctrl+Enter) to add it to the selected visual; with a selection, fields show "use as measure" / "use as axis". With nothing selected: "Select a visual first".
- Drag into a formula: dropped on a calculated field, Summary Calculation or styling-rule formula, a field fills the formula's next gap (an empty
SUM(), an empty argument, or an operator missing a side). See Formulas.
Fields from connected datasets. A visual can show fields of several datasets that the Connections tab links: drag Region from Customers and Amount from Orders into one bar chart, and it totals each order's amount under its customer's region. In the wells, a field from another dataset shows its dataset first ("Customers · Region").
- A field you split, list or test by (an axis, a legend, a grid column, a condition) is looked up for each row of the visual's own dataset, through as many connections as it takes (Orders → Customers → Regions). It has to sit on the side of the connection where each value appears once; a row with no match shows as blank.
- A number you total is totalled over its own dataset's rows, so one customer's credit limit isn't counted once per order. Two datasets can be totalled side by side when both connect up to what splits them: order amounts and refunds by region. A Count counts the visual's own rows, so it can't count another dataset's.
- A total can't be split by a dataset below it (customers' credit limit by order status): the visual says why above the chart.
- Dropping a field from a dataset that can't join the visual's (not connected, or connected only through many-to-many) doesn't add it. The message says why, with Switch this visual to dataset, which moves the visual onto that dataset and keeps only the fields it shares. A visual with no fields yet simply takes the new dataset.
- With a visual selected, each other dataset in the Data pane says whether its fields join it ("Joins the selected visual's Orders rows through the connections") or why not, with its fields dimmed.
A grid shows another dataset's columns read-only; editing them is done on their own dataset. Renaming a dataset or a column keeps every visual that shows it.
Column settings (a click on the column, or its pencil) open in that panel at the top of the Visual pane, titled with the column's type glyph and name (with Number / Category at the top right for a number column), and the column's row is highlighted. Picking another field switches the panel to it. Settings: Column name (the export header), Alias (the label every visual in this report shows; renaming in one visual's well changes only that visual); as a category, a number column's codes and years group and filter like text. The report keeps matching the column to the sheet's original header; the info icon beside the panel's title explains all of this. Done closes.
Format (in the same panel, and in a calculated field's) sets how a number or date column shows, like Excel's Format Cells. Number columns: General (as it is), Number (decimals, Use 1000 separator, and negatives as -1,234.10, (1,234.10), in red, or both), Currency (a symbol and decimals, the same negative choices), Percentage (the value times 100, so 0.256 shows 26%), Scientific (1.23E+04). Date columns: a list of date, date-and-time and time patterns, each shown on a value from the column, or Custom… to type one (yyyy, mmm, d, h:mm AM/PM and so on). A sample under the choices shows the result. The format is stored with the dataset, so every report on it shows the column the same way (on Try it, it is kept with the report). It shows in grid cells, chart values and KPIs (when the visual's own Format is Auto), date axes, slicers and filters; sorting, filtering by value, formulas and exports keep the raw value.
Field types are guessed from up to 500 values (number, date, month like "Dec-25", text); a type must fit 90% of them.
Summary Calculations holds the report's Summary Calculations (formulas over a dataset's rows, worked out per bar, slice or KPI). New creates one; Import… (workspace) brings in a saved one; clicking one opens its formula. Calculation panels save as you type unless Auto-save is unticked. See Formulas.
Adding a dataset#
Add dataset at the top of the Data pane adds one more dataset to the open report. It shows to people who can edit a workspace report (Mini and up), not on Try it or a saved version. The dialog, "Add a dataset to this report", offers:
| Choice | What it does | Plan |
|---|---|---|
| From the workspace | "A dataset it already has, live and replay datasets included." Search, pick one and click Add to report. Only datasets you can open and the report doesn't have yet are listed ("Every dataset you can open is already in this report."). | Mini and up |
| From a replay query | "Runs live for each reader, with the values you give it." Pick the Replay query and give its arguments values. On a dashboard each argument has a Value box: these are the only values the dashboard ever reads with, a required one (marked \*) must be filled, and one left empty uses the replay's default. On a printable report you set each argument to The report (one of its parameters sets it each run) or A fixed value. Give a Dataset name and an optional Folder, and click Save and add. It is saved in the workspace as a live replay dataset ("Saved in the workspace as a live dataset: it runs the replay for each reader with their own access, and stores no rows.") and added. | Ultimate, for people who can use the Query Workbench |
| From a data source | "A table, view, procedure or query text, read live." Opens the data source query editor; the live dataset it saves is added to the report. On a dashboard the procedure's parameter values you type are the only way it reads ("The dashboard always reads with these values; no filter, slicer or reader changes them."), so a required parameter with no default must have one. Shown once the workspace has a data source. Without the Data sources add-on, it says what to turn on. | Plus and Ultimate |
| From a spreadsheet | On Mini, a printable report only: Hold in memory while the report is open. The rows are read in your browser, never uploaded, and are lost when the report closes; saving the report keeps each tab's columns as a dataset in the workspace. On Plus and Ultimate, dashboards and printable reports alike, you choose: Save the data to the workspace (the default: each tab is uploaded now as a dataset with its rows) or Don't save the data (nothing is uploaded: each tab joins the report from your browser, and its dataset is made when you save the report, with its rows only if you choose; see Saving a report with data that isn't saved). Once the plan's saved datasets are used, only Don't save the data is open. In the desktop app a printable report holds it in memory, or stores it in a library. | Mini and up (Free: in its own builder, see below) |
| From a database… | The desktop app only, at the top of the dialog: "SQL Server, PostgreSQL, MySQL, Oracle or ODBC on your network." Opens the same database dialog as a report window's Add data; the dataset it reads goes into the report's workspace (the library, or copied up to the live workspace) and is added to the report. A stored procedure's parameters: on a dashboard you give each one a value in the dialog (empty uses its default, NULL can be ticked, and one with no default must have a value or NULL before Import), and the dashboard always reads with them. On On this computer, in a printable report, they become the report's: it gets one parameter per procedure parameter, and the procedure runs with their values when the report runs. | Every plan |
The dataset is added in one undo step ("name added to the report"). Its rows load at once; a live or replay dataset runs for you straight away.
Spreadsheets held in memory#
A dataset held in memory keeps only its columns in the report. When you open the report again, the dataset has no rows: the Data pane says Pick Sales.xlsx again under its name, and a printable report's preview shows the same above the sheets, beside the parameters. Click it and choose the file. The tab named after the dataset (or the first tab with all its columns) fills it, read in your browser and never uploaded. A file missing one of the dataset's columns is refused, naming what's missing. Until you pick the file, nothing shows from that dataset and the preview says "no rows: the spreadsheet isn't loaded". Reloading the page empties it again.
A printable report that holds a spreadsheet in memory can't be scheduled: Schedule says which datasets are held in memory and won't save or send a schedule (you can still pause or delete one). To schedule it, load the spreadsheet into a workspace dataset (Plus and Ultimate).
Live and replay datasets#
A live dataset (read from a data source when the report opens) has a lightning mark by its name, and a replay or stored procedure dataset has the replay mark beside it too. Point at the lightning mark, or click it to keep it open, for:
- "Live: runs when the report opens" (in a printable report, "Live: runs each time the report runs").
- What it reads and the values it reads with, for example "Runs dbo.SalesByRegion with @Region = West, @Year = 2026". A parameter left to its default says "its default"; in a printable report the ones its parameters set are named "from the report's parameters".
- How the last read stands ("Last read at time", "(cached)" when the rows came from the last minute's read, or what went wrong) and Read again.
- An input the data source sets from each reader's row access is named ("@Name is set from each reader's row access by the data source"): that is the one value that differs from reader to reader.
- On a dashboard: "Filters and slicers narrow these rows; they never change what is read."
- In a printable report, while you edit it, a warning when a parameter can be set to any value and nothing limits the rows: "Any reader can choose any value for @Name. Add a row access rule to this dataset, or have the data source bind the input to the reader's identity."
- Refresh live data while open (on a dashboard, on the first live dataset's mark): runs the same read again every 30 seconds to every hour while the report is open and showing, for everyone who opens it, on the website and in a desktop file. Off by default. The new rows replace the old ones once they arrive, so the visuals never go blank in between. It never reads more often than the data source keeps a result (at least 15 seconds); when that's longer than your choice, the tip says how often it actually reads.
Right-click the lightning mark for Read again. The mark turns red when the last read failed, or when the warning above applies.
The values a dashboard reads with. On a dashboard, the values you give a procedure, replay or data source query when you add it are the only way it runs. No filter, slicer or reader changes them: filters and slicers narrow the rows that were read, and Refresh, Read again and Refresh live data while open run the same read again. Everyone the dashboard is shared with sees the read someone who can edit it last made (its live-share), unless the data source sets an input from each reader's row access. To read with other values, change the dataset's source. A printable report is different: its parameters are picked each time it runs, and the procedure or replay runs with them.
Editing a dataset's source#
A dataset read from a data source, a database or a replay query has Edit source… in its block of the Data pane, for anyone who can edit the report and change the dataset (the same people who could replace it). It opens the dialog you added it with, filled in with what it reads now:
- From a data source: the data source (you can move the dataset to another one you can use), the table, view, procedure or query text, the columns, the filters, the parameter values (on a dashboard) or which parameters the report's parameters set (on a printable report), and Live (read when the report opens) or a stored copy.
- From a replay query: the replay query and its values (on a dashboard), or which arguments are fixed (on a printable report).
- From a database (the desktop app): the connection, the object or query text, the columns, the filters, the values, and for a library dataset whether its rows are kept or read when its reports run.
Saving overwrites the dataset: it keeps its name, and every visual, filter and parameter that names a column the new source still has keeps working. Before saving, the dialog names any column the report uses that the new source doesn't have ("The new source has no Region… Save anyway?"); Go back to change the source, or Save anyway, and rebind those visuals afterwards. When other reports read the same dataset, the dialog says how many: the change applies to all of them.
What happens to the rows:
- A stored dataset (kept and refreshed) is read again at once with the new source. If that read fails, nothing changes: the dataset keeps its old source and its old rows, and the dialog says why.
- A live dataset (read when the report runs) takes its new columns now; a dashboard reads it again straight away, and a printable report on its next run.
In a printable report, the parameters follow the new source: a new parameter of the source gets a report parameter, a report parameter whose source parameter is gone is removed, and one whose source parameter is still there keeps its settings (its label, values and NULL choice). A parameter you deleted stays deleted. Undo puts the old parameters back.
The dataset's run history records the change ("Edited …: Source changed: reads dbo.OpenOrders"), then the read that follows. A shared dashboard's viewers see the new source once someone who can edit it reads it again.
Saving grid edits#
On Plus and Ultimate, a row you save, add or delete in a Grid visual on a stored dataset is saved to the dataset straight away: the toast says "Row saved.", "Row added." or "Row deleted." once it is stored, or what went wrong. Edits that are still waiting (rows a save turned away, or a dry run) show Save changes in the dataset's Data pane block, and Save all edits in the toolbar saves every such dataset in turn. Saving the report never sends edits. Up to 1,000 changed rows go in one save; the rest wait for the next.
A dataset nothing saves to from the grid (one read from a file, or a plan without saved edits) keeps the edit in the report only, and the toast says "Row updated in this report only."
Where the edits go is the dataset's write-back: an uploaded dataset with no write actions saves to its own rows; any other dataset saves through its write actions, in order.
While a save runs, the dataset's grids are read-only and say so above the rows, for example "Saving: step 1 of 2, Update order, 40 of 120 rows Editing is paused until it finishes." The Data pane block shows the same progress ("Waiting to save…" first) and a disabled Saving… button.
| Outcome | What you see |
|---|---|
| Everything saved | "n rows saved." The edits are cleared and the dataset's rows load again, so held live updates arrive. |
| Some rows turned away | "n rows saved. n rows couldn't be saved; they stay in the grid, marked with the reason." The saved rows leave the edits. A "n not saved" chip shows in the Data pane, and a note above each grid on the dataset gives the first reasons ("n edited rows couldn't be saved: …"). Fix them and save again. |
| More than 1,000 rows | "… n more wait for the next Save changes (at most 1,000 a save)." |
| Edits the dataset can't take | They aren't sent: "n rows can't be saved; they're marked in the grid." Reasons include "Field can't be changed on this dataset.", "Field is a key field, which is never changed." and "Field is required on a new row." |
| A dry run passed | "Dry run passed: the data source accepted these changes and rolled them back, so nothing was saved yet. Save changes again to write them." No popup; your edits stay. See Dry run. |
| The save failed | Nothing leaves the edits. A popup over the builder, "Your changes to dataset weren't all saved", names the step, the action and the reason, and lists the rows that went through before it stopped (those stay saved). It stays until you click Dismiss. See When a save fails. |
When a dataset has edits but no Save changes, a line under them says why, for example "These edits stay in this report until you export it: the dataset isn't saved in the workspace."
The Connections pane#
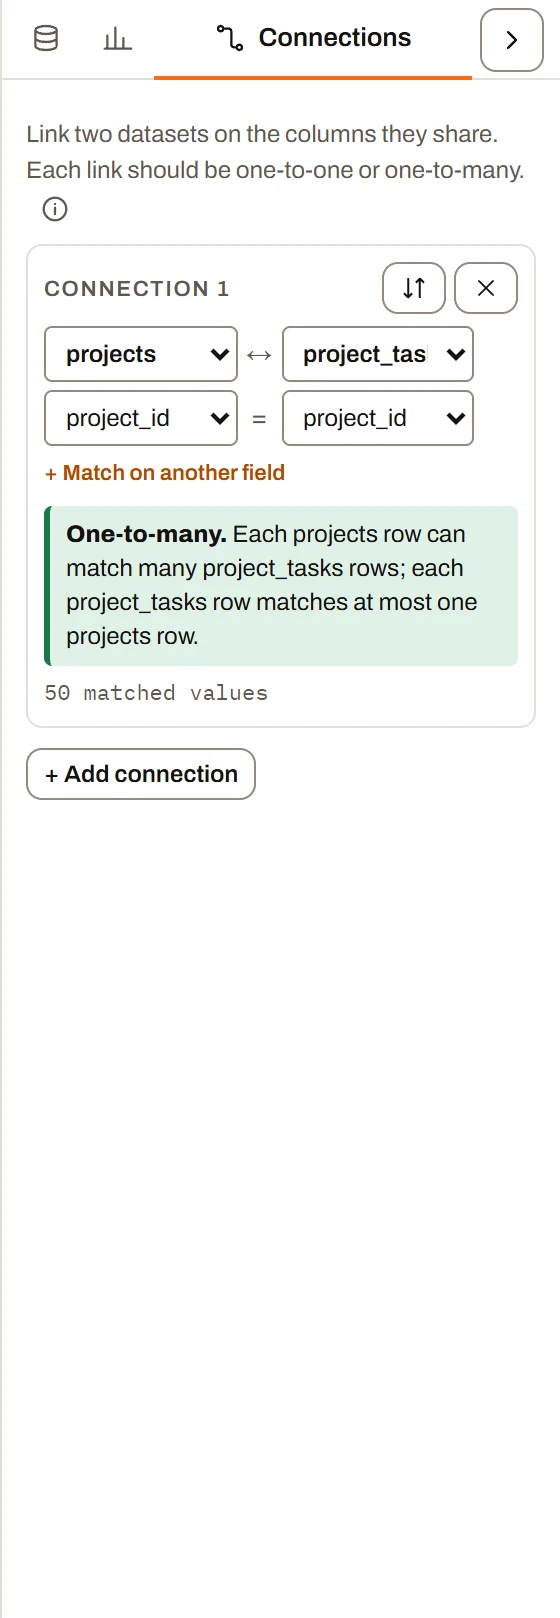
The Connections pane: projects linked to project_tasks on their shared column.
Shown with two or more datasets: "Link two datasets on the columns they share. Each link should be one-to-one or one-to-many." Connections let a grid nest one dataset's rows under another's, let a click on one dataset filter visuals on the other (Filters and interactions), and let formulas read across datasets (Formulas).
Each card: the two datasets, column pairs (+ Match on another field), Swap sides, Remove connection, and a live check: One-to-one, One-to-many, Many-to-one (green) or Many-to-many (warning, View n rows). + Add connection guesses a first pair from a shared header. From your datasets marks one set on the Datasets page; removing it here lasts only until the report reopens.
Connections made here are saved with the report and work for that report on every plan. Workspace-wide connections on the Datasets page are a separate feature; see Datasets.
The connection diagram#
Open diagram, at the top of the Connections tab, shows the same connections as a picture over the whole builder. The report stays open behind it, and Close (or Esc) brings you straight back. It is there while you edit a report with two or more datasets; viewers don't see it.
- Every dataset is a card with its row count and the fields its connections match on (Show n more fields lists the rest). Every connection is a line between the matched fields, marked 1 on a side that holds each value once and ∗ on a side that repeats it. A many-to-many line is dashed in red, and a connection with no fields picked yet is dotted.
- Pick a card to see that dataset's connections in a panel, grouped as Filters (datasets a filter on it narrows), Filtered by, Matched one-to-one and Not filtering yet. Each has the same controls as the Connections tab, and Connect to another dataset adds a new one. The other cards light up to show where a filter on the picked dataset reaches.
- Pick a line to change or remove that one connection.
- Drag a field onto a field of another card to connect the two datasets on those fields, or to add the pair to the connection they already have. Dropping on a card's name matches a field of the same name.
- Drag a card to move it. The arrangement is saved with the report, so everyone who edits it sees the same picture; Tidy up puts every card back where the automatic layout puts it. Arrow keys move a picked card too.
- Every change is a step you can undo, with the diagram's own Undo and Redo or Ctrl+Z and Ctrl+Y.
The canvas#
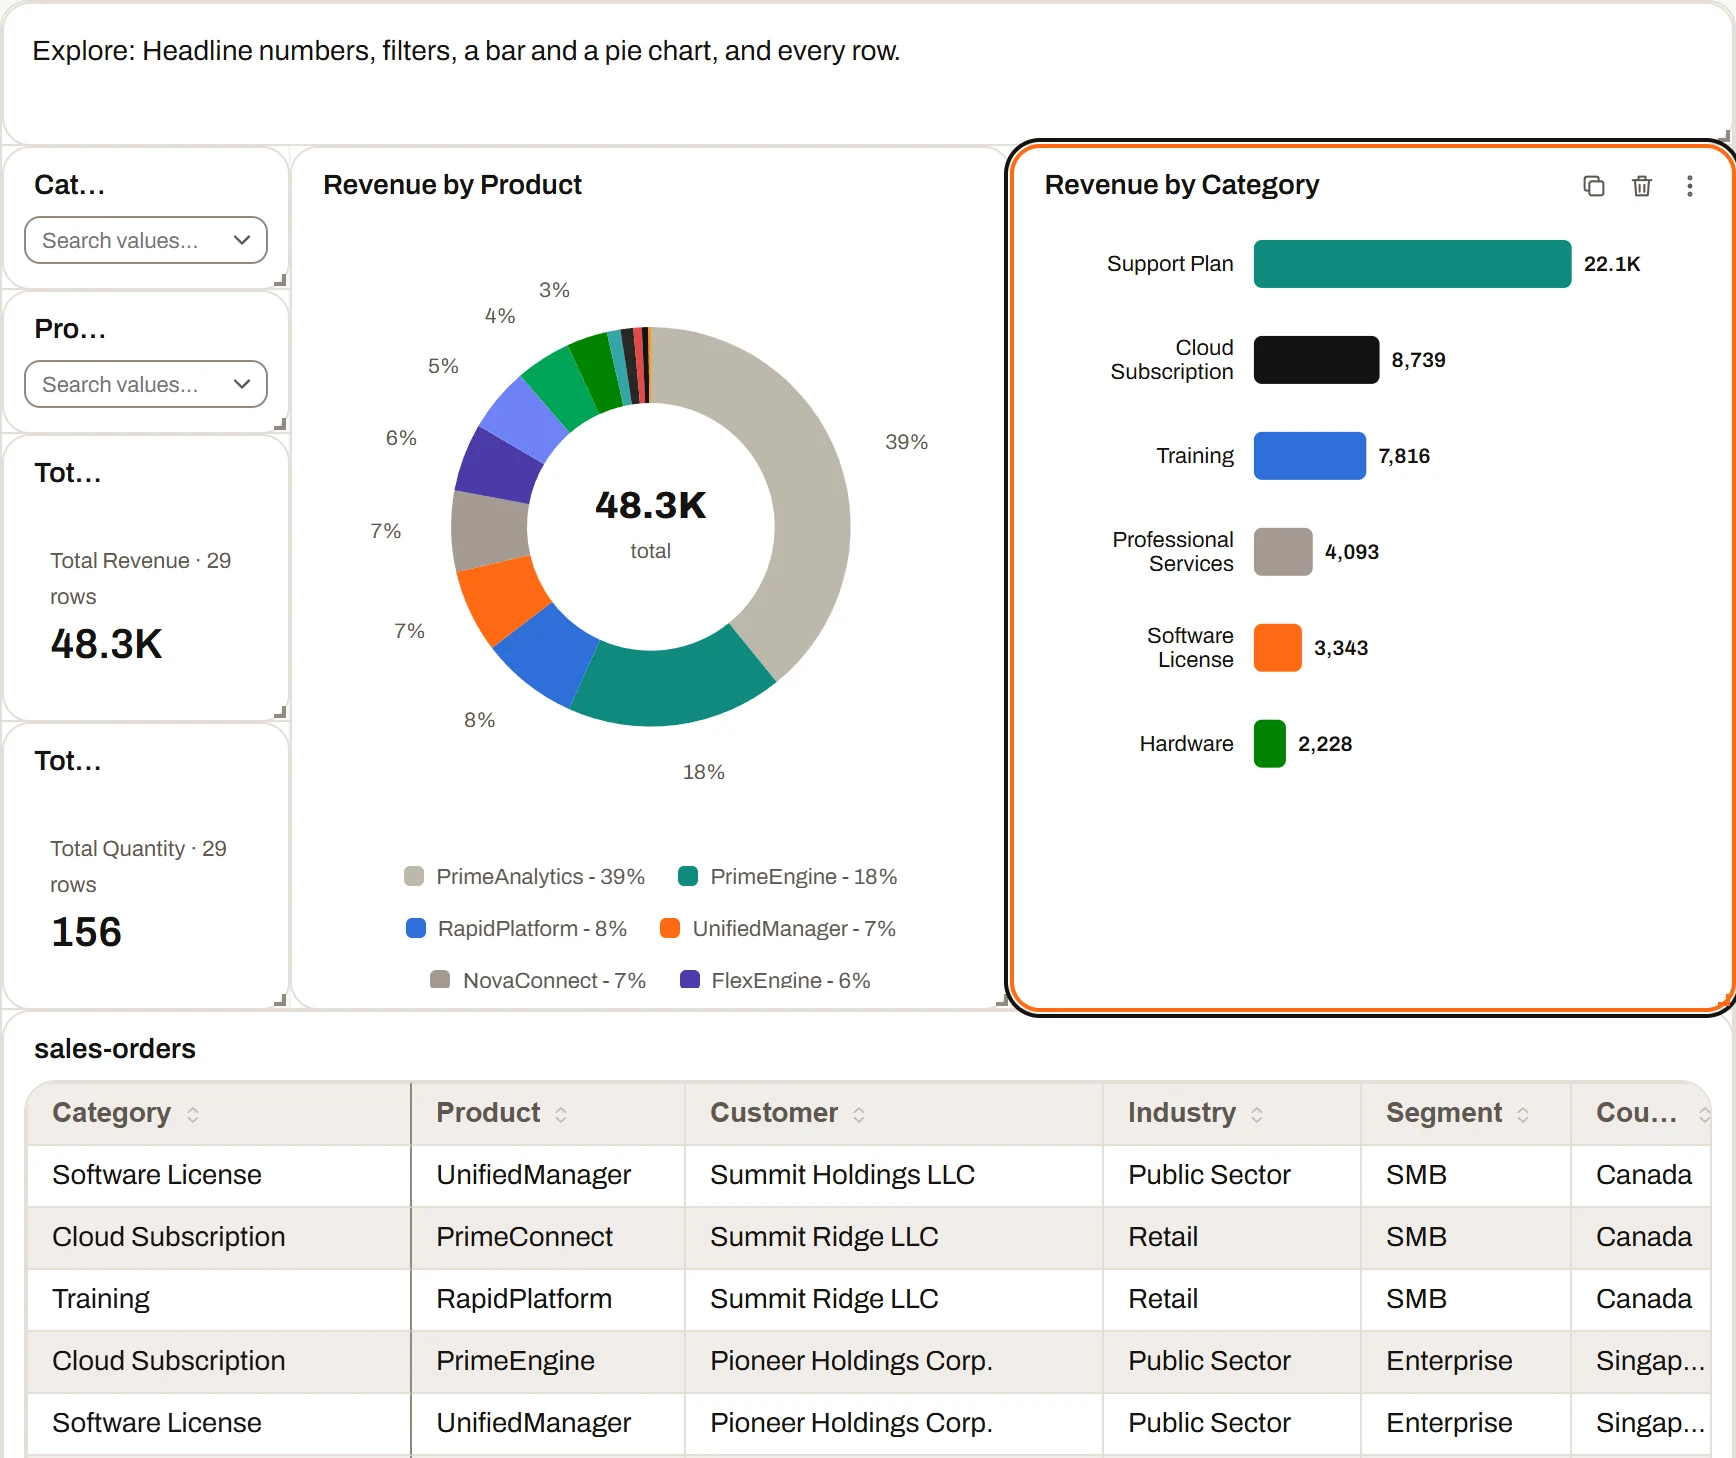
The canvas, with a visual selected.
Empty page: "Drag a visual from the Visuals pane onto this page." (Dash view: "This page is empty.").
The grid and snapping#
- A page is 72 columns wide; rows are 24 pixels. Positions and sizes are whole cells, so everything snaps.
- Columns stretch with the window; rows don't.
- Edit mode draws a strong line every 9 columns and 3 rows, a faint one every 3 columns and every row.
- The page always has 34 spare rows below the lowest visual (an empty page is 34 rows tall); it grows as you drag lower.
- Visuals never overlap and never push each other. There are no alignment or bring-to-front / send-to-back tools.
- Reports from an older, coarser grid are scaled up when they open.
Selecting visuals#
In Edit mode: click to select (settings open in the Visual pane); Ctrl/Cmd/Shift+click to add or remove; drag on empty canvas for a selection box (Ctrl/Shift adds); Ctrl+A selects all; click empty canvas or Escape clears. With several selected: "n visuals selected. Drag any of them to move them together, Ctrl+C copies them, Ctrl+V pastes and Delete removes them. Click one on its own to set its fields, format and filters."
Moving and resizing#
- Move: drag the title bar (or the grip shown on hover when the header is hidden). Dropped over another visual, it slides to the nearest open space or shrinks to fit a gap nearby ("Resized to fit the space").
- Move several: drag any selected visual; all move together, stop at page edges together, and drop only if none lands on another visual ("Not enough room" otherwise). Clicking without dragging selects just that one.
- Resize: drag one of eight edge/corner handles. Each type has a minimum size. An overlapping resize is refused ("Not enough room").
- Works in Edit mode, or in Dash view when Unlocked. Each is one undo step.
Copy, cut, paste and duplicate#
| Action | How | Notes |
|---|---|---|
| Duplicate | Duplicate on the title bar | Copy at the first open space, selected. |
| Copy | Ctrl+C, or Copy in More options | Copies the selection ("Copied n visuals"). Highlighted page text is copied instead. |
| Cut | Ctrl+X | Copy, then delete. |
| Paste | Ctrl+V, or Paste in More options (greyed until something is copied) | Onto the open page (any page of the report). Same places if free, otherwise the group goes to the first open space. Pasted copies are selected. |
Copies are held by the builder, not your computer's clipboard; they're lost when you leave the builder, and keep their dataset and settings.
Deleting#
Delete on the title bar, or Delete/Backspace for the whole selection (one step; not while typing). Undo restores.
The title bar and its menu#
Edit mode: Duplicate, Delete, More options with Rename (also double-click the title; Enter finishes), Copy, Paste, Hide Header / Show Header, Bring to front and Send to back (where a visual sits when visuals overlap, such as a title over a shape). A hidden header disappears in Dash view; in Edit mode it shows on hover as a grip and tools over the top edge. A visual set to ignore page clicks shows Ignores selection when a click elsewhere would otherwise filter it.
The Visual pane#
Three tabs across the top, drawn like the rail's:
- Visual: the selected visual's settings (see Visual options), or the multi-select note. Offered only while a visual is selected; its tooltip is the visual's title.
- Filters: filters for all pages, this page, and the selected visual. See The Filters tab.
- Bookmarks: saved states of a page. See Bookmarks.
With nothing selected the pane shows Filters. Selecting a visual switches it to Visual; selecting another while Filters or Bookmarks is open keeps that tab, so you can read each visual's filters in turn. The toolbar's History button shows the history in the pane's place.
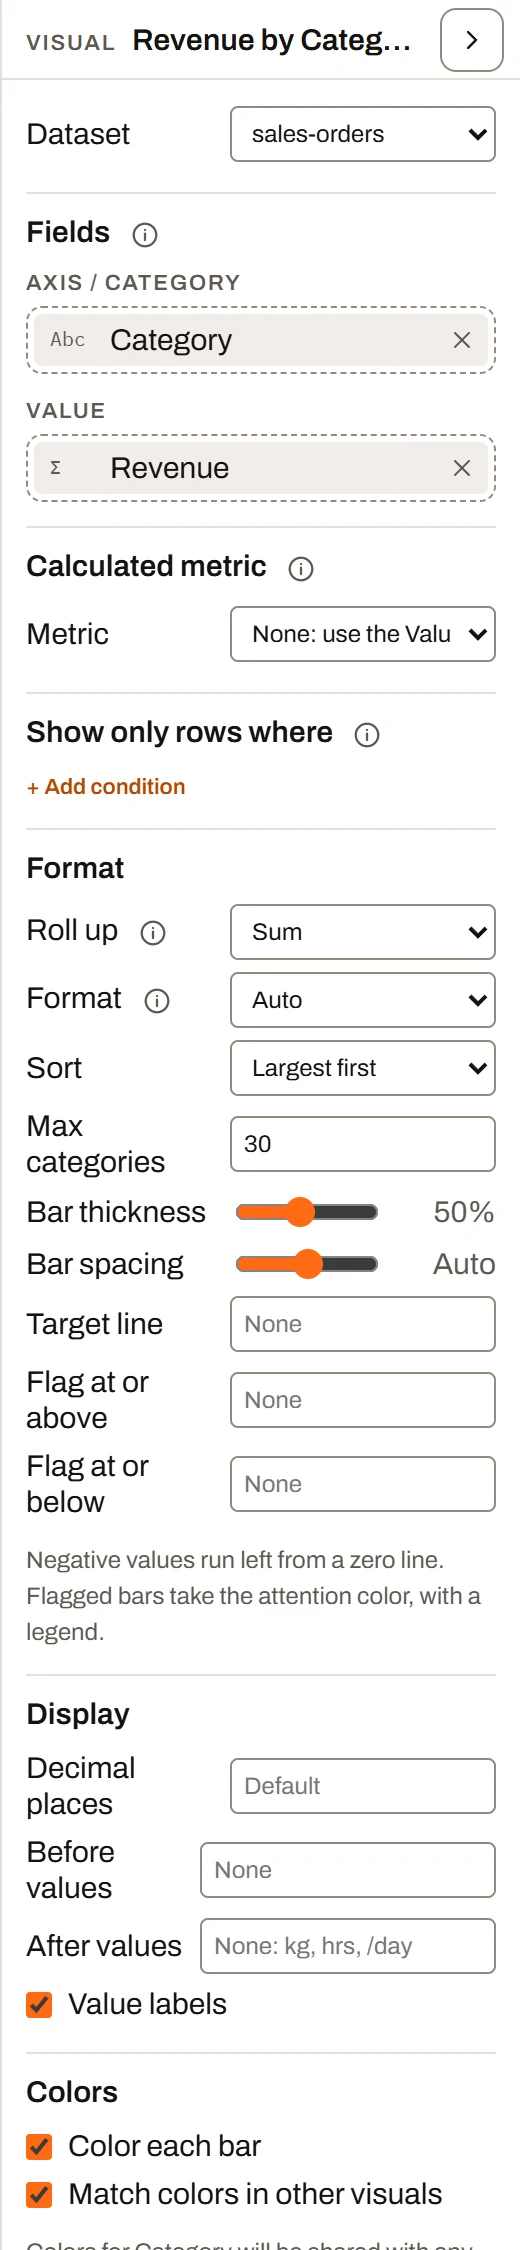
The Visual pane, showing a bar chart’s settings.
The Filters tab#
A folding section per scope: This visual (only while one visual is selected; its own dataset's columns), This page, and All pages. Each shows how many filters it holds, its filter chips (Clear all) and a checkbox block per text or date column. Above them, the current click-selection. See Filters and interactions.
Bookmarks#
A bookmark saves one page as it is now: its name, every visual with its settings, place and visual filters, and the page's filters. Add bookmark saves the open page as "Bookmark 1", "Bookmark 2"… and lets you type a name straight away (Enter saves, Escape keeps the default). Each row shows the name, the page it restores, and how many visuals and filters it holds.
Click a bookmark to open it. Right-click it, or use its ⋯ button, for:
- Open: puts the page back exactly as it was saved, in place: visuals added since are removed, deleted ones come back, settings and filters return. If that page has been deleted, it comes back as a new page.
- Copy: a copy named "name (copy)", right after it.
- Create page from: a new page at the end, named after the bookmark, that matches it. The original page is left alone.
- Add button: adds a button that opens the bookmark to the open page, in the first open space.
- Copy link (saved workspace reports, on a plan that shares): copies the report's public link so that it opens to this bookmark. Save the report first if it has unsaved changes; the link works once the report is public.
- Update from this page: saves the open page into the bookmark, keeping its name.
- Rename (or double-click it) and Delete.
You can also drag a bookmark from the list onto the page: it lands as a button that opens it, where you drop it.
Each is one undo step. Bookmarks are saved with the report. Filters for all pages and click-selections aren't part of a bookmark.
History, undo and redo#
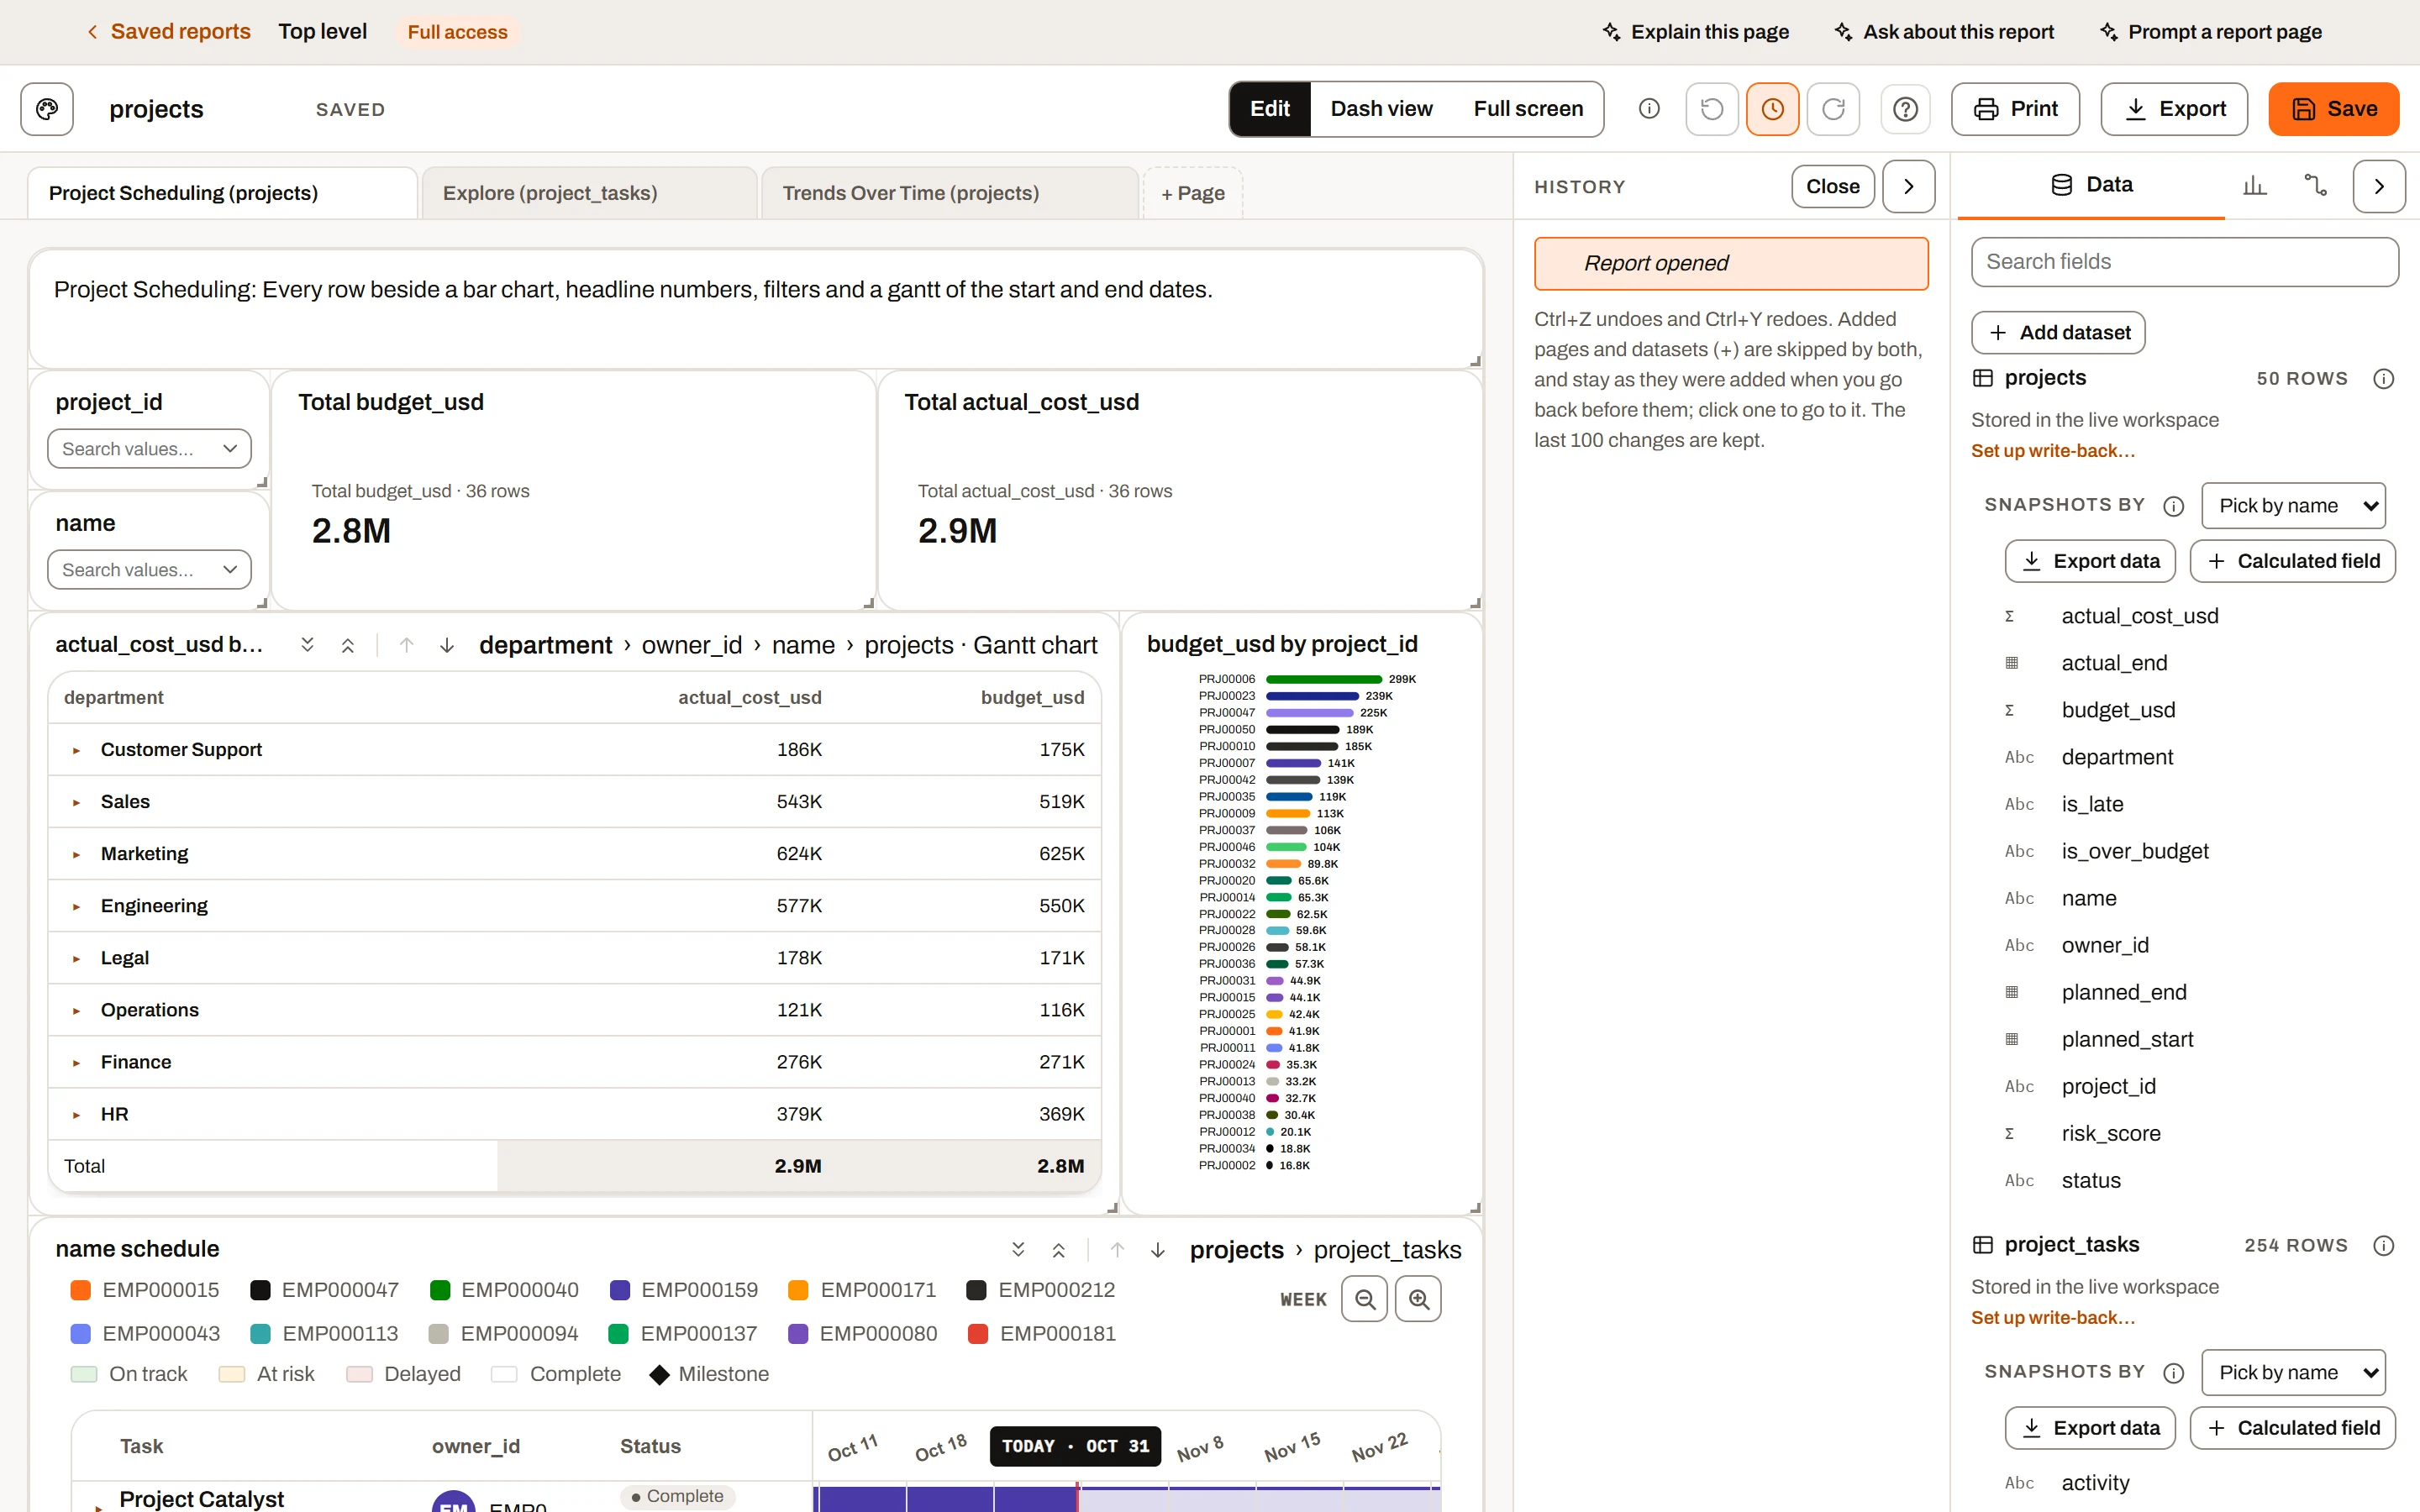
The history list: every change since the report was opened, click one to go back to it.
- Almost every change is one step: visuals, fields, settings, filters, pages, themes, column renames, connections.
- Undo (Ctrl+Z) / Redo (Ctrl+Y or Ctrl+Shift+Z).
- Runs of typing in the report name, a title or a text visual (pauses under about 4 seconds) are one step; a colour drag is one step.
- History lists changes newest first with time, down to Report opened. Click a row to go there; the current point is highlighted, undone ones dimmed. Close returns to settings.
- The last 100 changes are kept.
- Added pages and datasets are marked +; Undo/Redo skip them; going back before one keeps it as added ("kept as added").
- A new change after undoing drops undone steps (kept additions stay).
- Saving keeps the history; reopening or importing restarts it.
- Not in history: grid row edits (use Revert edits) and click-selections.
Toasts#
Short messages at the bottom for about 2 seconds ("Copied 2 visuals", "Not enough room", "Report saved", "Row updated"). Announced to screen readers; a new one replaces the last.
Printing and print preview#
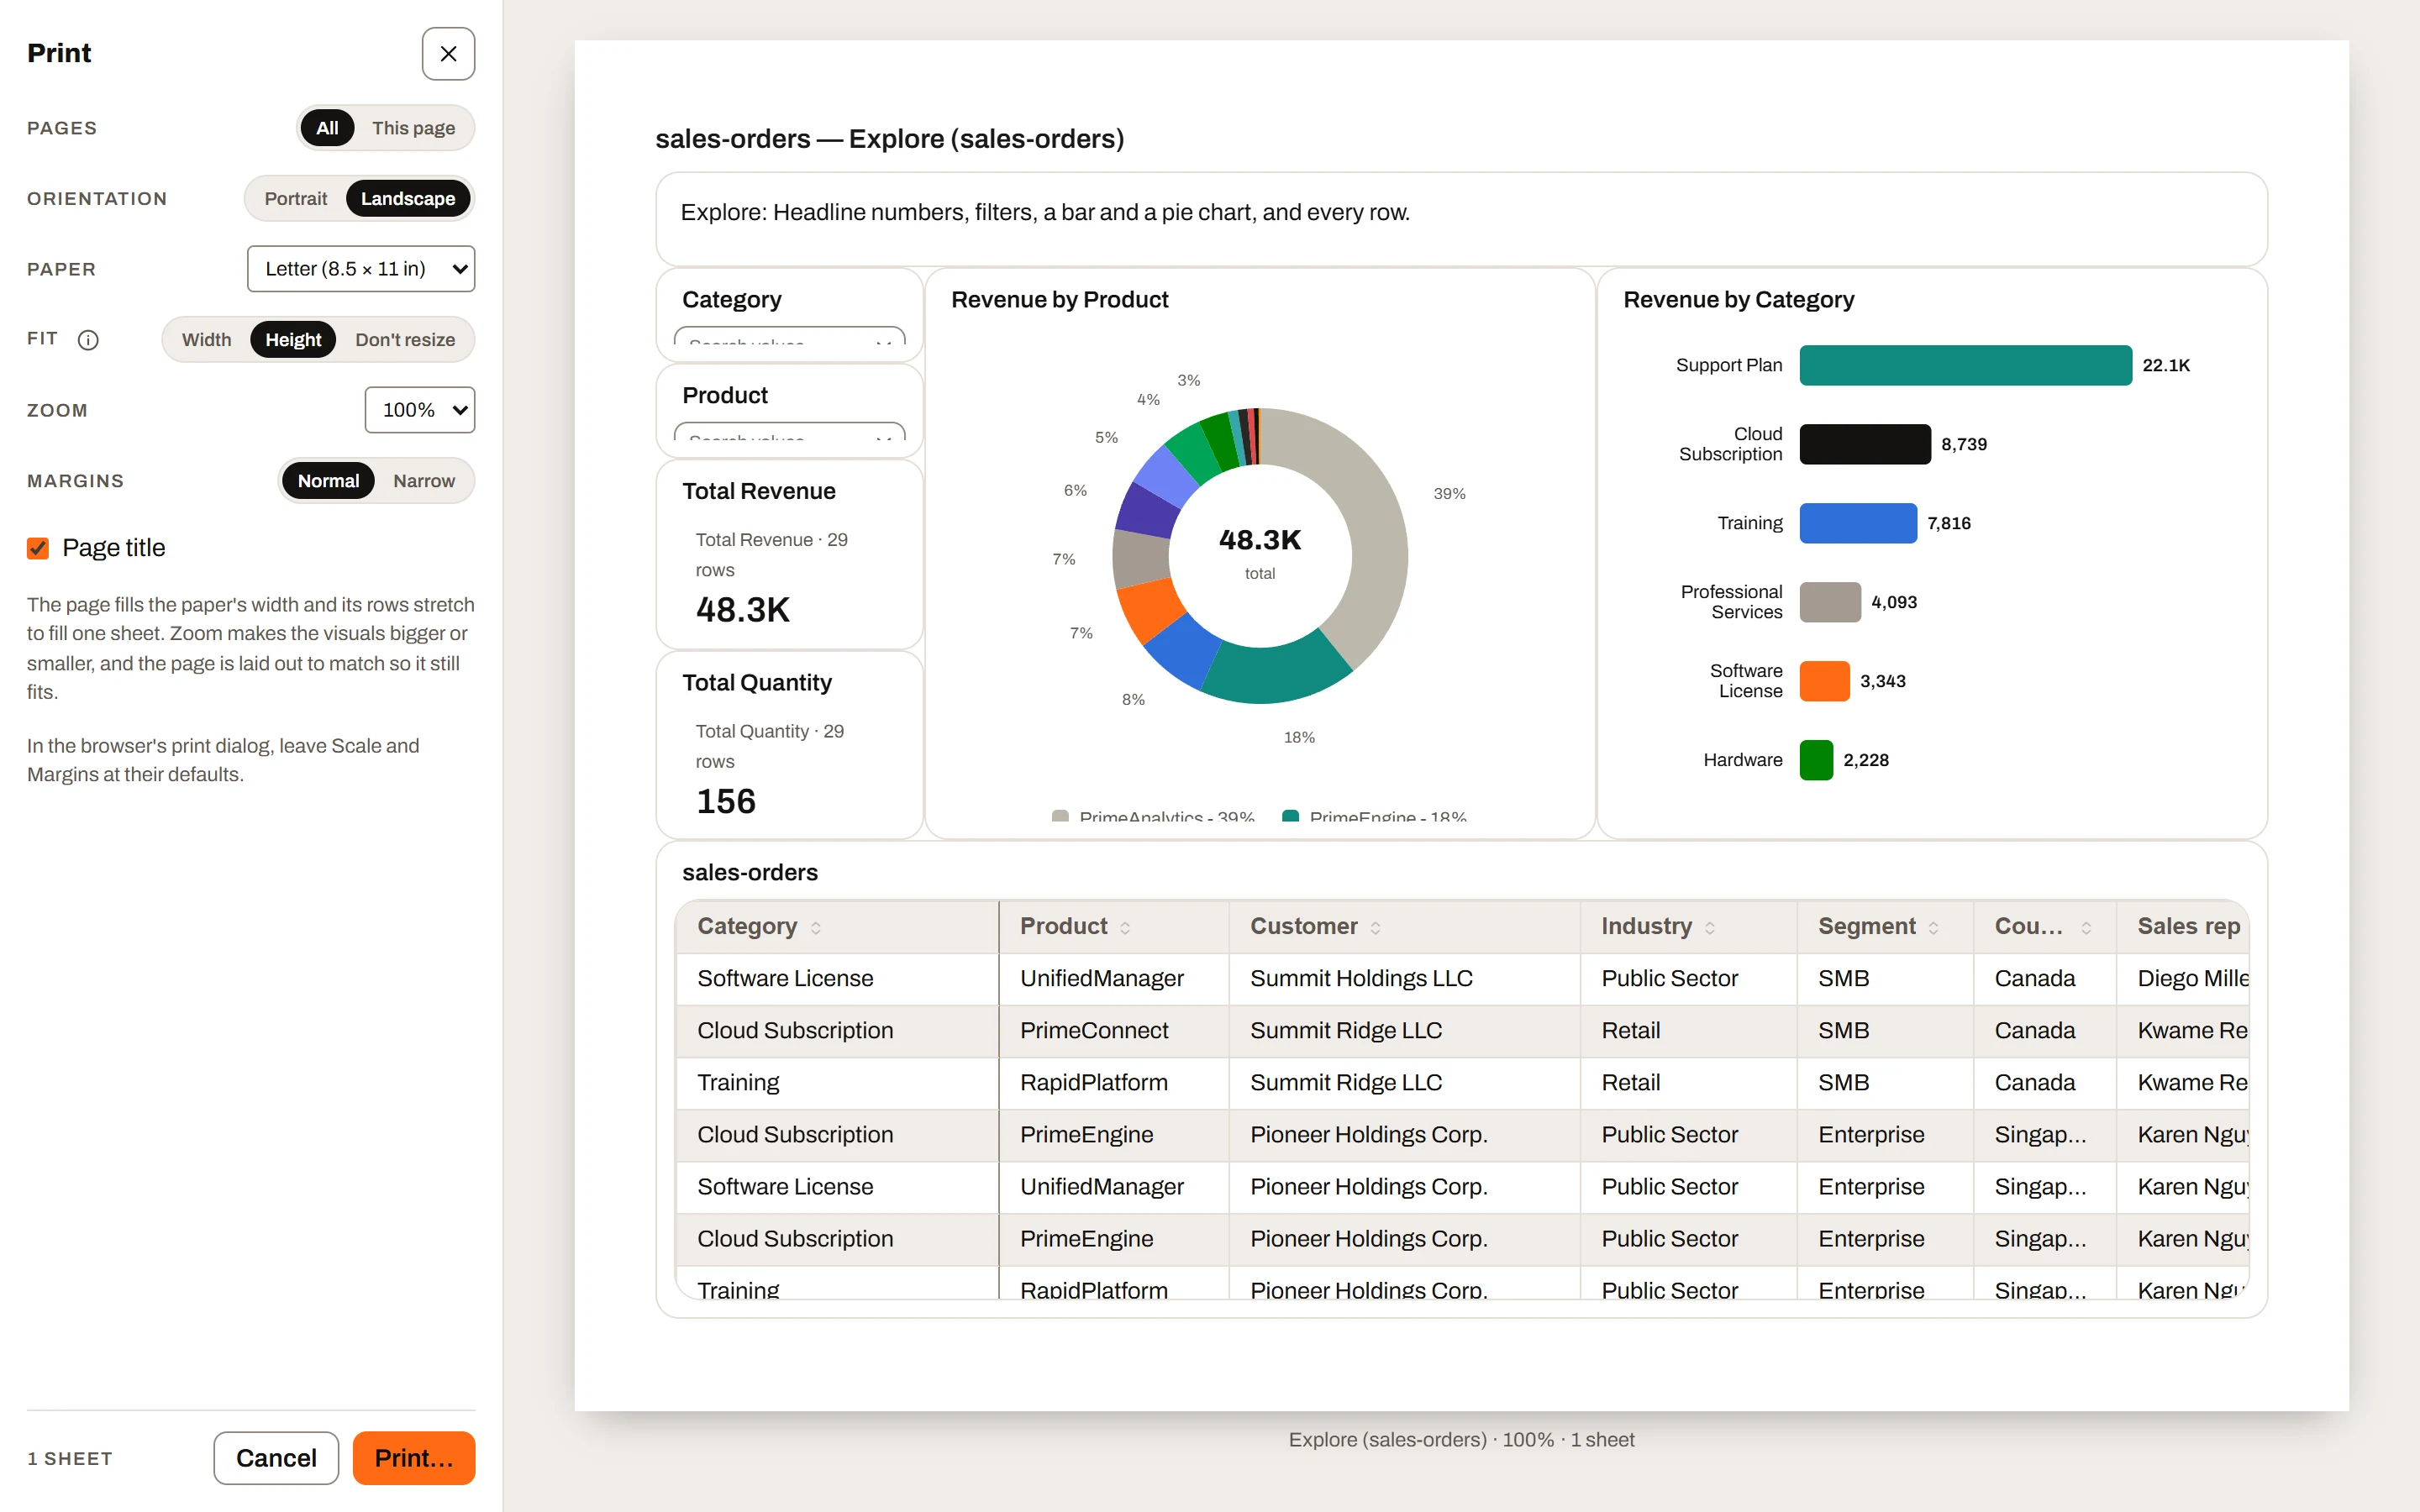
The print preview.
Print (every plan, everyone who can open the report) opens a full-screen Print preview: settings on the left, each page on its sheets on the right.
| Setting | Options | Default |
|---|---|---|
| Pages | All / This page | All |
| Settings for | All pages or one page (with all pages, more than one page) | All pages |
| Orientation | Portrait / Landscape | Landscape |
| Paper | Letter (8.5 × 11 in) / A4 (210 × 297 mm) | Letter |
| Fit | Width (fills width; long pages run onto more sheets), Height (fills width and stretches rows to one sheet), Don't resize (screen width; wide pages cut off at the right) | Height |
| Zoom | 50% to 200% (50, 67, 75, 80, 90, 100, 110, 125, 150, 175, 200) | 100% |
| Margins | Normal (0.5 in) / Narrow (0.25 in) | Normal |
| Page title | Prints "Report — Page" above each page | On |
Hidden pages are never listed or printed; with a hidden page open, This page is greyed out and All prints.
Per-page: pick a page in Settings for or click its sheet, and changes apply only to it; Use the all-pages settings drops them; Print this page leaves it out (faded). Pages can differ in paper, orientation and margins. Captions show scale, sheets, "own settings", "cut off at the right"; dashed lines mark sheet breaks; the footer counts sheets.
Print… opens the browser's print dialog (preview stays open); Cancel, close or Escape closes it. Leave the browser's Scale and Margins at defaults. Choose "Save as PDF" for a PDF. Settings last while the builder is open.
Print configurations#
A print configuration is a saved set-up of Print: which pages, the paper, orientation, fit, zoom, margins and titles, each page's own settings and the pages left out, and, if you choose, the filters to print with. It is saved with the report, so everyone who can open the report can print with it, on the website and in the desktop app.
- Print configuration, at the top of the Print settings, lists Default (the settings above) and the report's configurations. Picking one sets everything it saved; one that printed a single page opens that page.
- Save as… (editors) saves the current settings under a name. Tick Keep the current filters and values to keep each page's filters and the All pages values with it: picking it later puts them back, whatever is picked by then. Selections made by clicking charts aren't kept.
- Save changes appears when the settings differ from the picked configuration, and writes them into it (its filters stay as they were).
- The ⋯ menu (editors) has Rename, Keep the current filters (take the filters again from the pages as they are now), Remove its filters, Move up, Move down, Copy link and Delete. Copy link copies the report's public link with
?print=, which opens Print on that configuration; save the report first so the link finds it. - A filter on a field that is no longer in the report is left out when the configuration is picked, with a note saying which.
- Each of these is a step in the report's history, and the report shows Unsaved until you save it.
- A Button visual can open Print on a configuration: set its On click to Print and pick the configuration (or Default).
Scheduling a dashboard#
Schedule on the toolbar (editors, a saved workspace report; not in a file opened in the desktop app) emails the dashboard on a schedule, with the same schedules, recipients, access checks and history as printable reports:
- Print with picks the print configuration the email prints (or Default). Save the report after adding a configuration, since a schedule prints the report as it is saved.
- As is a link, an attached file or both. The file is a PDF: the sheets Print makes with that configuration, laid out for each recipient with only the rows their own access allows.
- A link opens the dashboard as it was when it was sent, in Dash view, with that configuration's filters, for the person signed in. Print there opens Print on the same configuration, and Download PDF fetches the attached file when there was one.
- Parameters lists the dashboard's All pages values, which a schedule can set for everyone or from a recipients dataset's fields.
Keyboard shortcuts#
Cmd replaces Ctrl on a Mac.
| Keys | Action | Where |
|---|---|---|
| Ctrl+S | Save (Free: "Sign up to save reports") | Anywhere, even while typing |
| Ctrl+Z | Undo | Edit mode, not typing |
| Ctrl+Y, Ctrl+Shift+Z | Redo | Edit mode, not typing |
| Ctrl+C / Ctrl+X / Ctrl+V | Copy / cut / paste visuals | Edit mode, not typing |
| Ctrl+A | Select all visuals on the page | Edit mode, not typing |
| Delete, Backspace | Delete selected visuals | Edit mode, not typing |
| Escape | Clear selection (and leave a box); in a filtering visual, clear its selection; close print preview | Anywhere |
| Ctrl/Shift + click visual | Add to / remove from selection | Edit mode |
| Ctrl/Shift + drag on canvas | Add boxed visuals to selection | Edit mode |
| Enter | Add focused Visuals card; add focused field to selected visual; finish renaming report, visual or page; open focused page tab | Edit mode (tabs both) |
| Tab / Shift+Tab in a page name | Save and move to next / previous page name | Edit mode |
| Double-click a visual's title | Rename | Edit mode |
| Double-click / arrow keys on a pane edge | Reset / resize by 16 px | Edit mode |
| Ctrl/Cmd + click a mark | Add to / remove from the click-selection | Both |
| Enter or Space on a focused mark | Click it | Both |
"Typing" means a text box, drop-down or editable text has focus; checkboxes and buttons don't count.
Leaving with unsaved work#
- Try it and the Free-plan builder: once a file is loaded, leaving opens Leave this page? ("You will lose your changes. The file you loaded isn't saved anywhere, so you'd have to load it again."): Stay here, Open in new tab, Leave and lose changes. Escape or clicking outside counts as Stay here. Reload or closing the tab shows the browser's own prompt. Leaving clears the file and report.
- A saved report: the same dialog only when there are unsaved changes.
Try it vs. a signed-in builder#
| Try it | Free (new report) | Mini | Plus | Ultimate | |
|---|---|---|---|---|---|
| Account | No | Yes | Yes | Yes | Yes |
| Data lives | Your browser | Your browser | Read from your files each open | Stored for 10 datasets, rest from files | Stored for 50 datasets |
| Spreadsheets per report | 2 | 5 | 10 | No limit | No limit |
| Save | No ("Sign up for Save and Export") | No | Workspace (definition) | Workspace | Workspace |
| Export Definition / Import… | No | No | Yes | Yes | Yes |
| Export Package | No | No | No | Yes | Yes |
| Export data (.xlsx) | No | No | Yes | Yes | Yes |
| Yes | Yes | Yes | Yes | Yes | |
| Visual types | 10 | 10 | 33 | 33 | 33 |
| Page templates | 2 basic | 5 basic | 9 basic | 9 + 31 | 9 + 31 |
| Grid row editing | No (read-only) | No (read-only) | Yes | Yes, saved with Save changes | Yes, saved with Save changes |
| Snapshot datasets | No | No | No | No | Yes |
- Try it reads
.xlsx,.xlsm,.xls,.csv,.tsv,.txtin the browser; nothing is uploaded. Several tabs ask "You have n tabs. Which should we include?" (all ticked); Open the report, and later Change tabs. Drop more files on the header's Upload more. Full builder, but two of Free's page templates (Explore and Category Breakdown). See Getting started. - Dashboard or printable report: pick Dashboard or Printable report under What to make, above the drop box, before you drop a file. The report is made as that kind and stays it; the strip above the builder names it. A printable report holds each spreadsheet in memory while the page is open ("The spreadsheets are held in memory while this page is open; nothing is kept when it closes.").
- Free-plan builder: "Reports / New report" link back; "Up to 5 spreadsheets in a report. Nothing is saved on the Free plan, and your file stays on your computer." Past 5, extra sheets are listed unticked with "A free workspace can use up to 5 spreadsheets in a report. Untick one to swap another in, or upgrade for more."; "Pick up to 5." and extra boxes greyed while 5 are ticked.
Grid row edits update every visual on the dataset at once and go out with Export data and Package. On Mini they last only for the session (Try it and Free have a read-only grid). On Plus and Ultimate they are saved to a stored dataset with Save changes or Save all edits (Saving grid edits); saving the report itself never saves them.
Plan limits summary#
| Feature | Free | Mini | Plus | Ultimate | Try it |
|---|---|---|---|---|---|
| Save reports | No | Definition only | Yes (rows for 10 datasets) | Yes (rows for 50) | No |
| Export Definition, Import… | No | Yes | Yes | Yes | No |
| Export Package | No | No | Yes | Yes | No |
| Export data (.xlsx) | No | Yes | Yes | Yes | No |
| Export visuals (image/PDF) | No | No | Plan switch on, not built | Plan switch on, not built | No |
| Yes | Yes | Yes | Yes | Yes | |
| Visual types in Visuals pane | 10 | 33 | 33 | 33 | 10 |
| Page templates | 5 basic | 9 basic | 9 + 31 dashboards | 9 + 31 dashboards | 2 basic |
| Spreadsheets per report | 5 | 10 | No limit | No limit | 2 |
| Grid row editing | No | Yes (session only) | Yes, saved with Save changes | Yes, saved with Save changes | No |
| Add dataset to an open report | No | From the workspace | From the workspace or a data source (with the add-on) | From the workspace, a replay query or a data source (with the add-on) | No |
| Snapshot datasets | No | No | No | Yes | No |
| Report-level connections | Yes | Yes | Yes | Yes | Yes |
| Themes, pages, canvas, history, shortcuts | Yes | Yes | Yes | Yes | Yes |
Enforcement: the builder hides what a plan lacks. The server refuses saves on plans without saving and saves past the report count. The 5-spreadsheet limit and the visual and template lists are browser-only.