
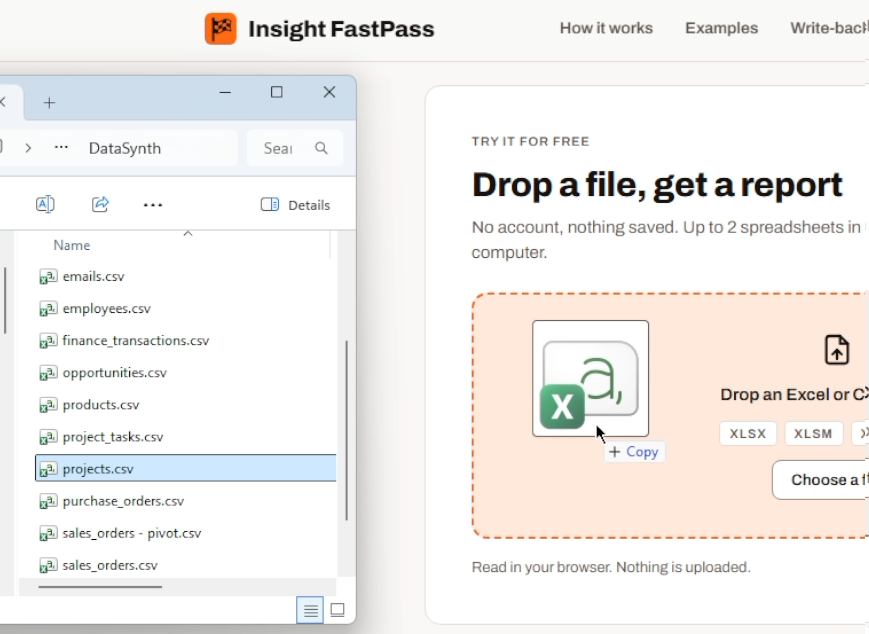
Add a file or a database
Drag in a CSV or Excel file — an export, a workbook someone emailed you, the sheet you update every Friday — or connect a database. On the free try-it page the file is read in your browser and never leaves your computer.
BetaFree accounts and the desktop app are available now. Paid plans, with reports on the web, sharing and live connections, launch once enough people ask for them. Express your interest
Reporting without the learning curve
Upload a CSV or Excel file, or connect SQL Server, PostgreSQL, MySQL or Oracle. The first page builds itself, templates fill in the rest, and filters and drill-down work across the whole report. Fix a number where you see it, print an invoice from the same data, and share the report without buying a license for everyone who reads it.
Available now in the desktop app This is the beta. Build from a spreadsheet in the browser, or sign in to the free desktop app to save reports and connect your own databases on your computer. Saving and sharing on the web, and live connections from the website, launch once enough people express interest.
Built to replace
From spreadsheets
From other BI tools
How it works

Drag in a CSV or Excel file — an export, a workbook someone emailed you, the sheet you update every Friday — or connect a database. On the free try-it page the file is read in your browser and never leaves your computer.
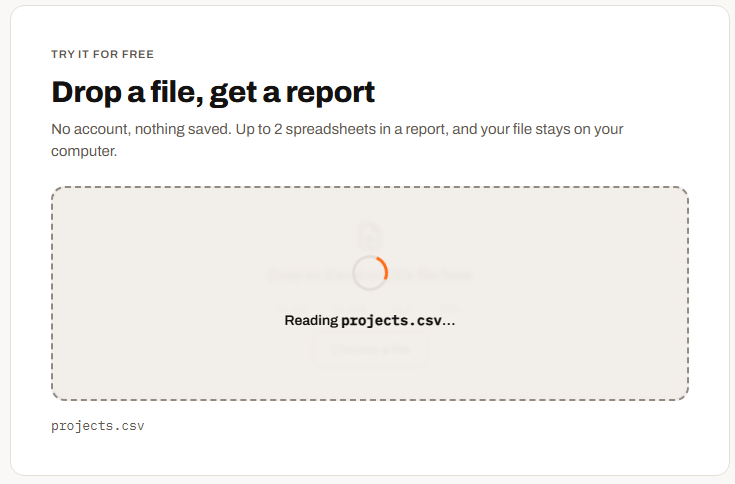
Dates, numbers and currency are recognized for you, and the rows are on screen before anything is built. If a workbook has several sheets, pick the ones to bring in, and fix any column type that came out wrong.
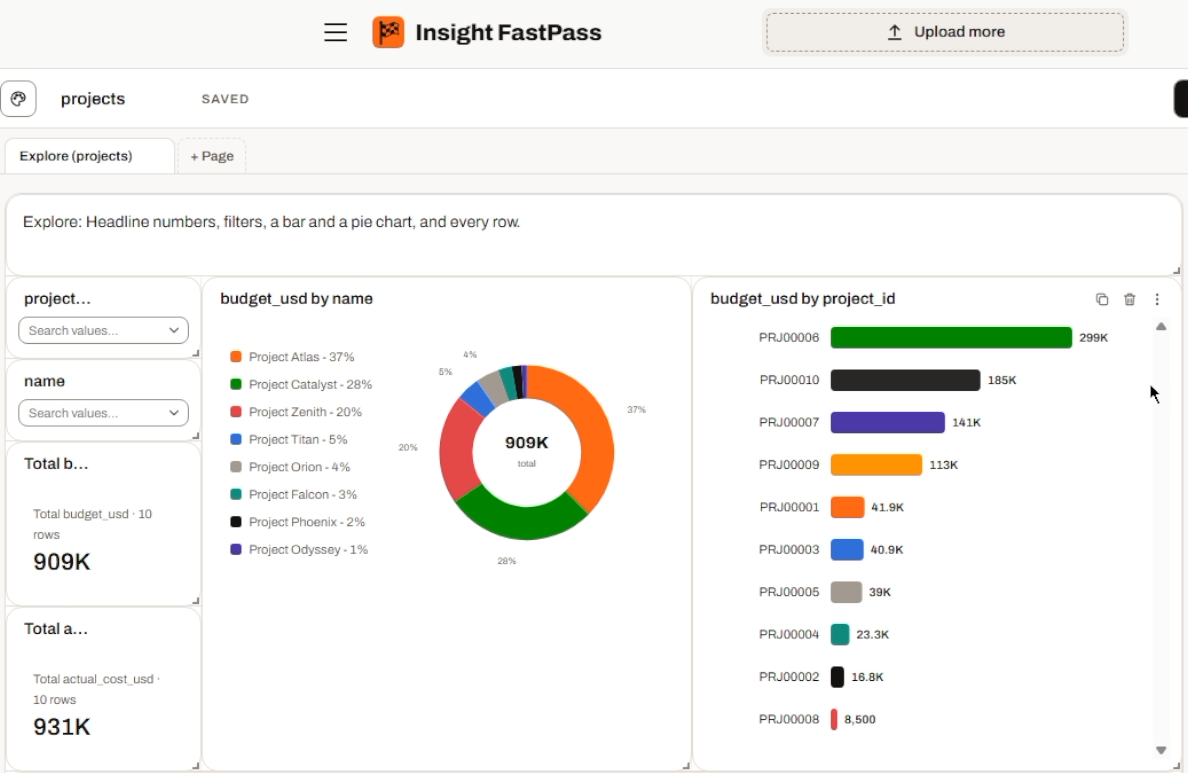
A first page with filters, totals, charts and a grid of every row appears on its own. Add pages from templates matched to your columns, link datasets on a shared column, and save the report so next month’s data drops straight into it.
Before and after · demo
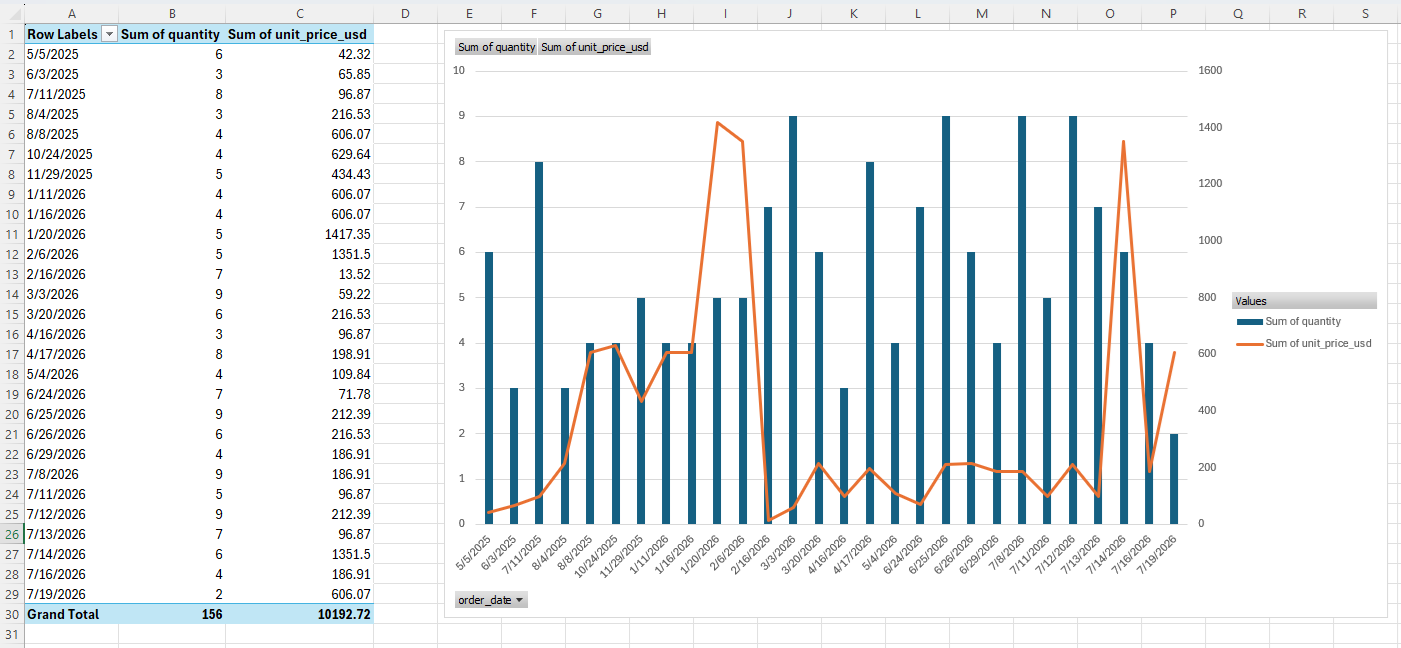
A demo on sample data: the Excel report on top is the kind that gets rebuilt by hand every time the export changes. Underneath is the same breakdown built in Insight FastPass from the same rows in minutes — the numbers agree to the cent, and nobody rebuilt a pivot.
Before
After
Demo — the Insight FastPass version: the same breakdown, live
Watch the demo · 3½ minutes
Recorded on the free try-it page with sample project data: a page that builds itself, filters that follow a click, a second file linked to the first, a page from a template and the print preview. Pick a chapter to jump ahead.
What it looks like · live demos
Every row of the sample spreadsheet, sorted, filtered and exported in the browser, with each project’s tasks nested right under it — open a row to see who has each task, when it was due and whether it’s done. The kind of register that usually gets emailed around before every meeting — try the column filters, they are the real ones.
Revenue by product category against customer segment, shaded so the big numbers stand out, with totals on both edges. The Excel pivot, except it rebuilds itself when you upload the new file.
The same rows ranked rather than totaled: which product categories bring in the most revenue, largest first, so the answer is read off the top of the chart instead of hunted for in a legend.
Everything you’d expect from BI
Connected data, interactive reports, shared calculations, current numbers, row-level access and a place to fix what’s wrong — all in the browser, priced per workspace.
Connect
Spreadsheets alongside SQL Server, PostgreSQL, MySQL or Oracle databases in one report, linked on the columns they share.
Without a networking project. Cloud databases connect with no stored password, and on-site ones through a gateway that only connects outward.
Connect your dataInteract
Cross-filtering, drill up and down, drill-through pages, bookmarks and buttons, a filter on every grid column, and grids, Gantt charts and matrices that open to the rows underneath, up to 4 levels deep.
Without wiring up every drill path by hand.
See the live examples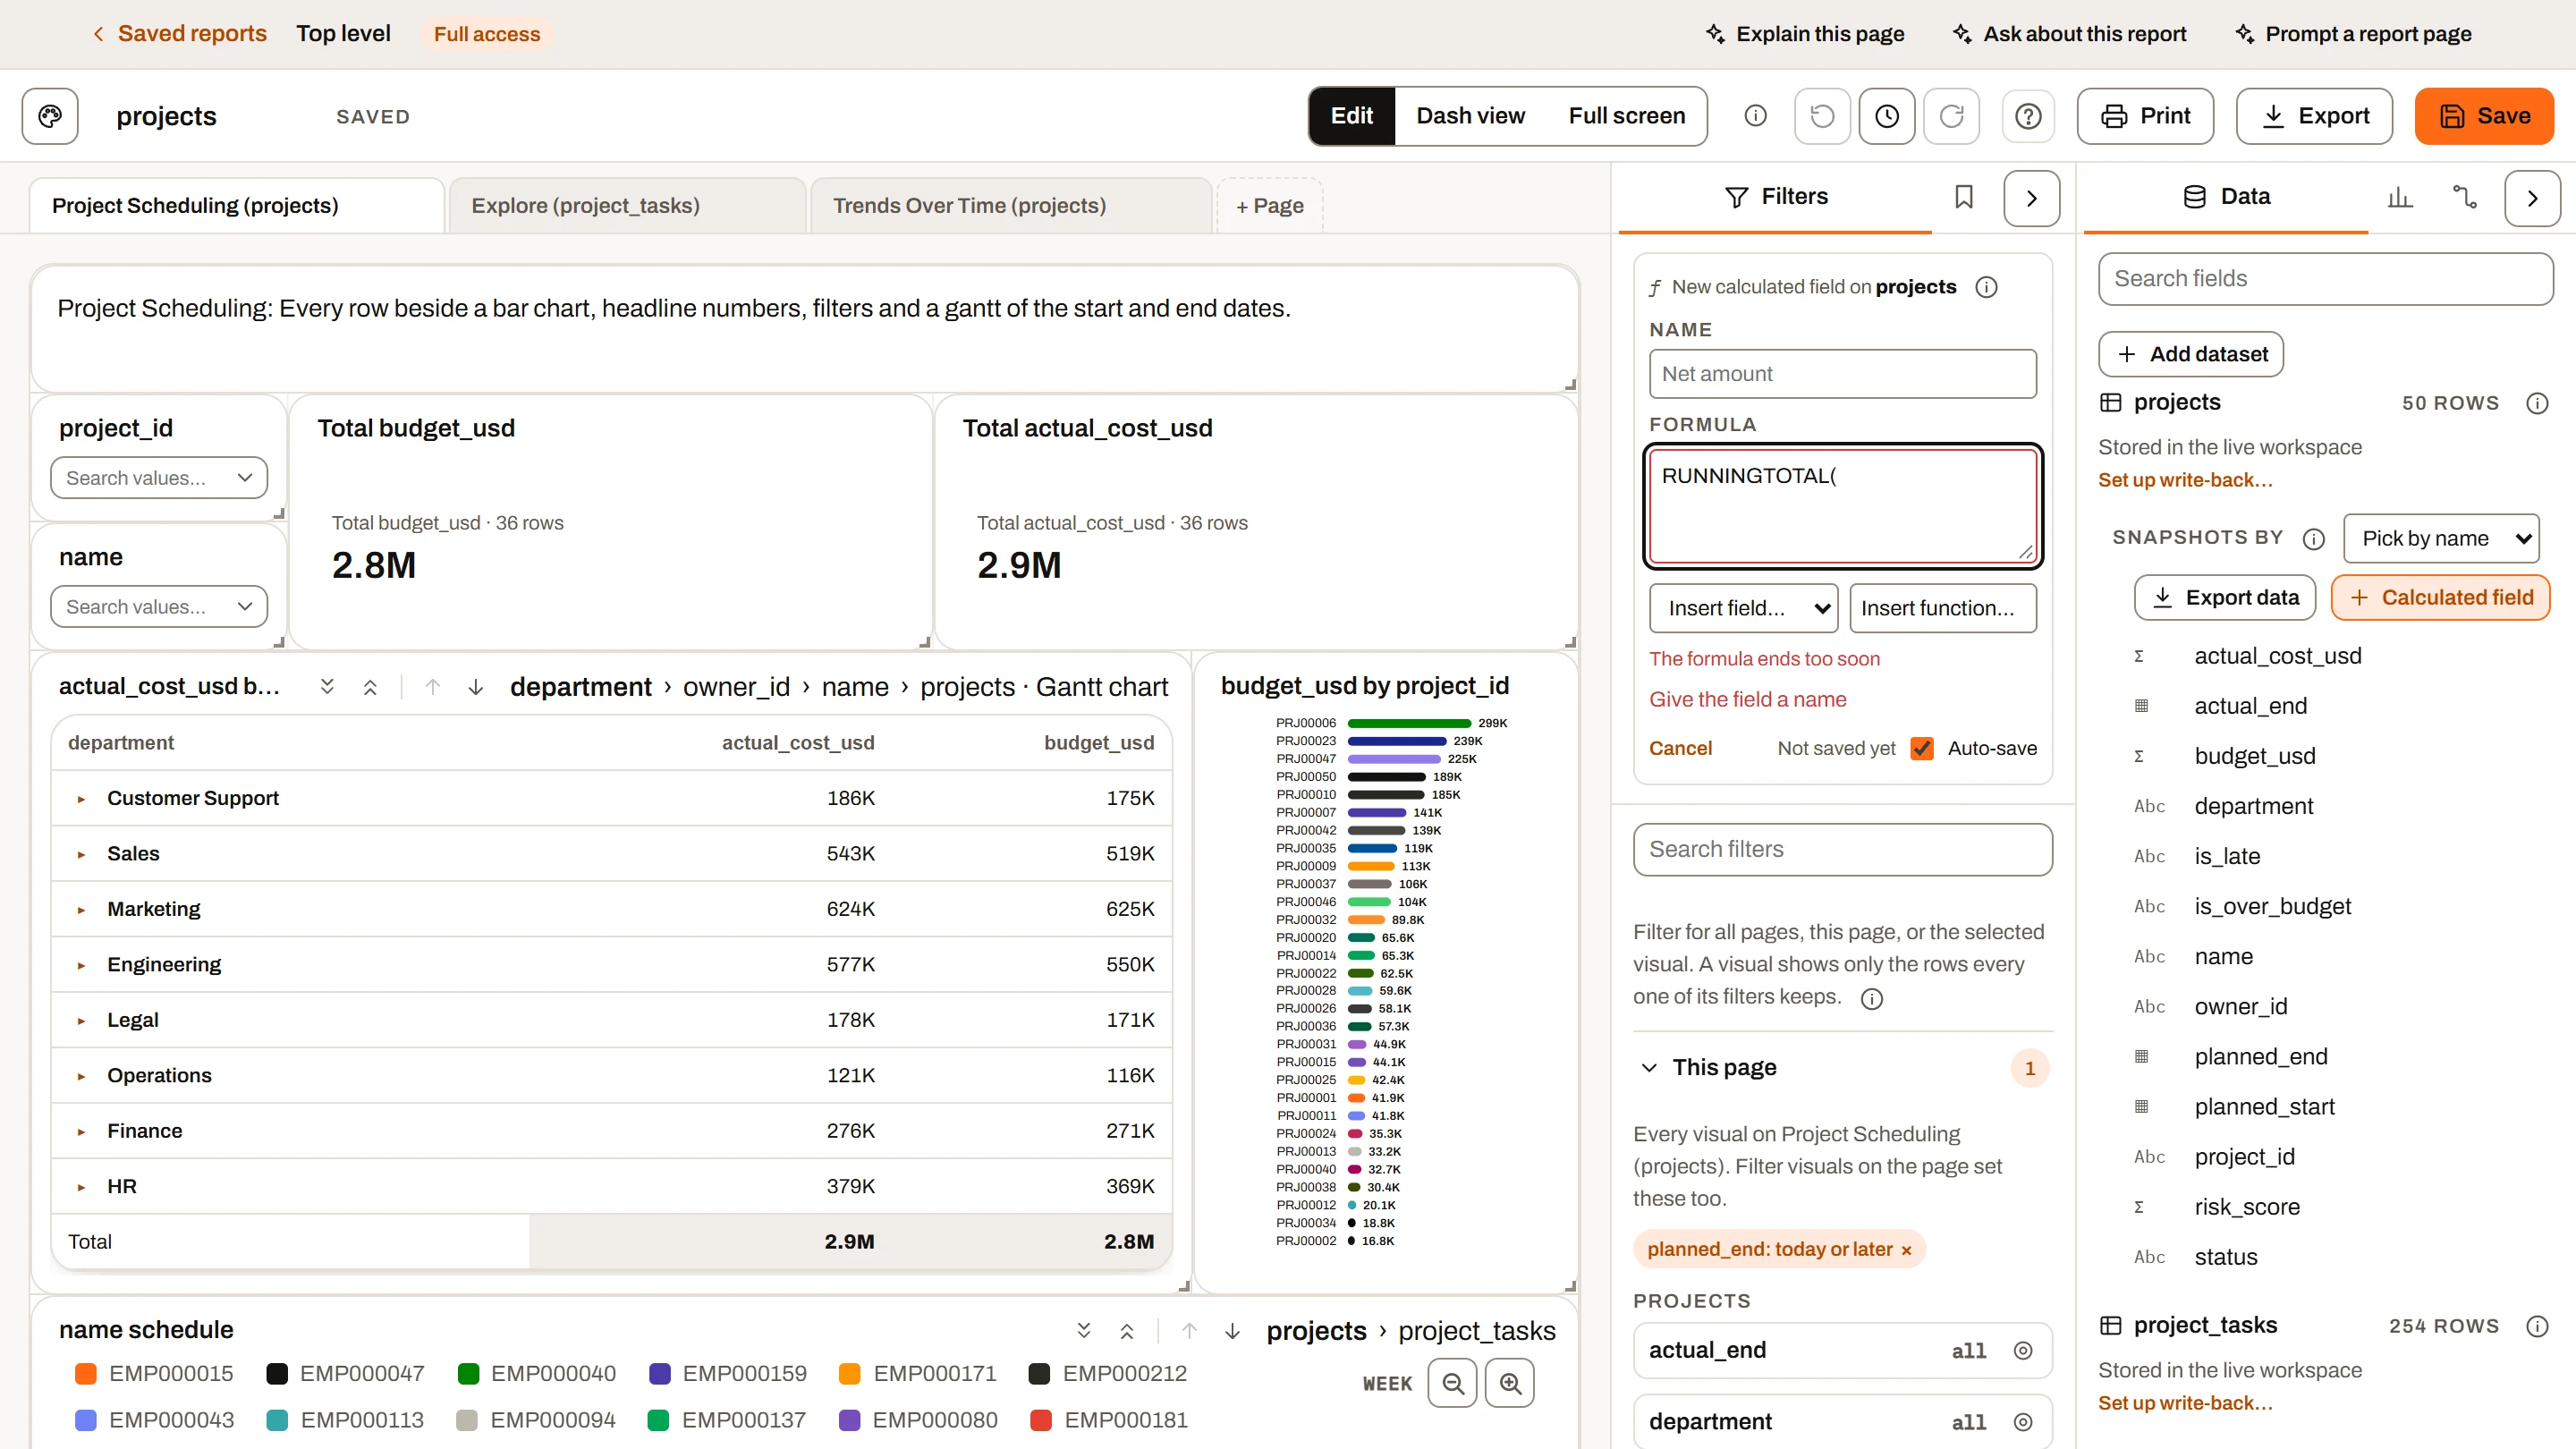
Calculate
Calculated fields and Summary Calculations in a spreadsheet-style formula language, with autocomplete: running totals, last-period comparisons, ranks and lookups.
Without learning a new language before the first total.
Calculations & queries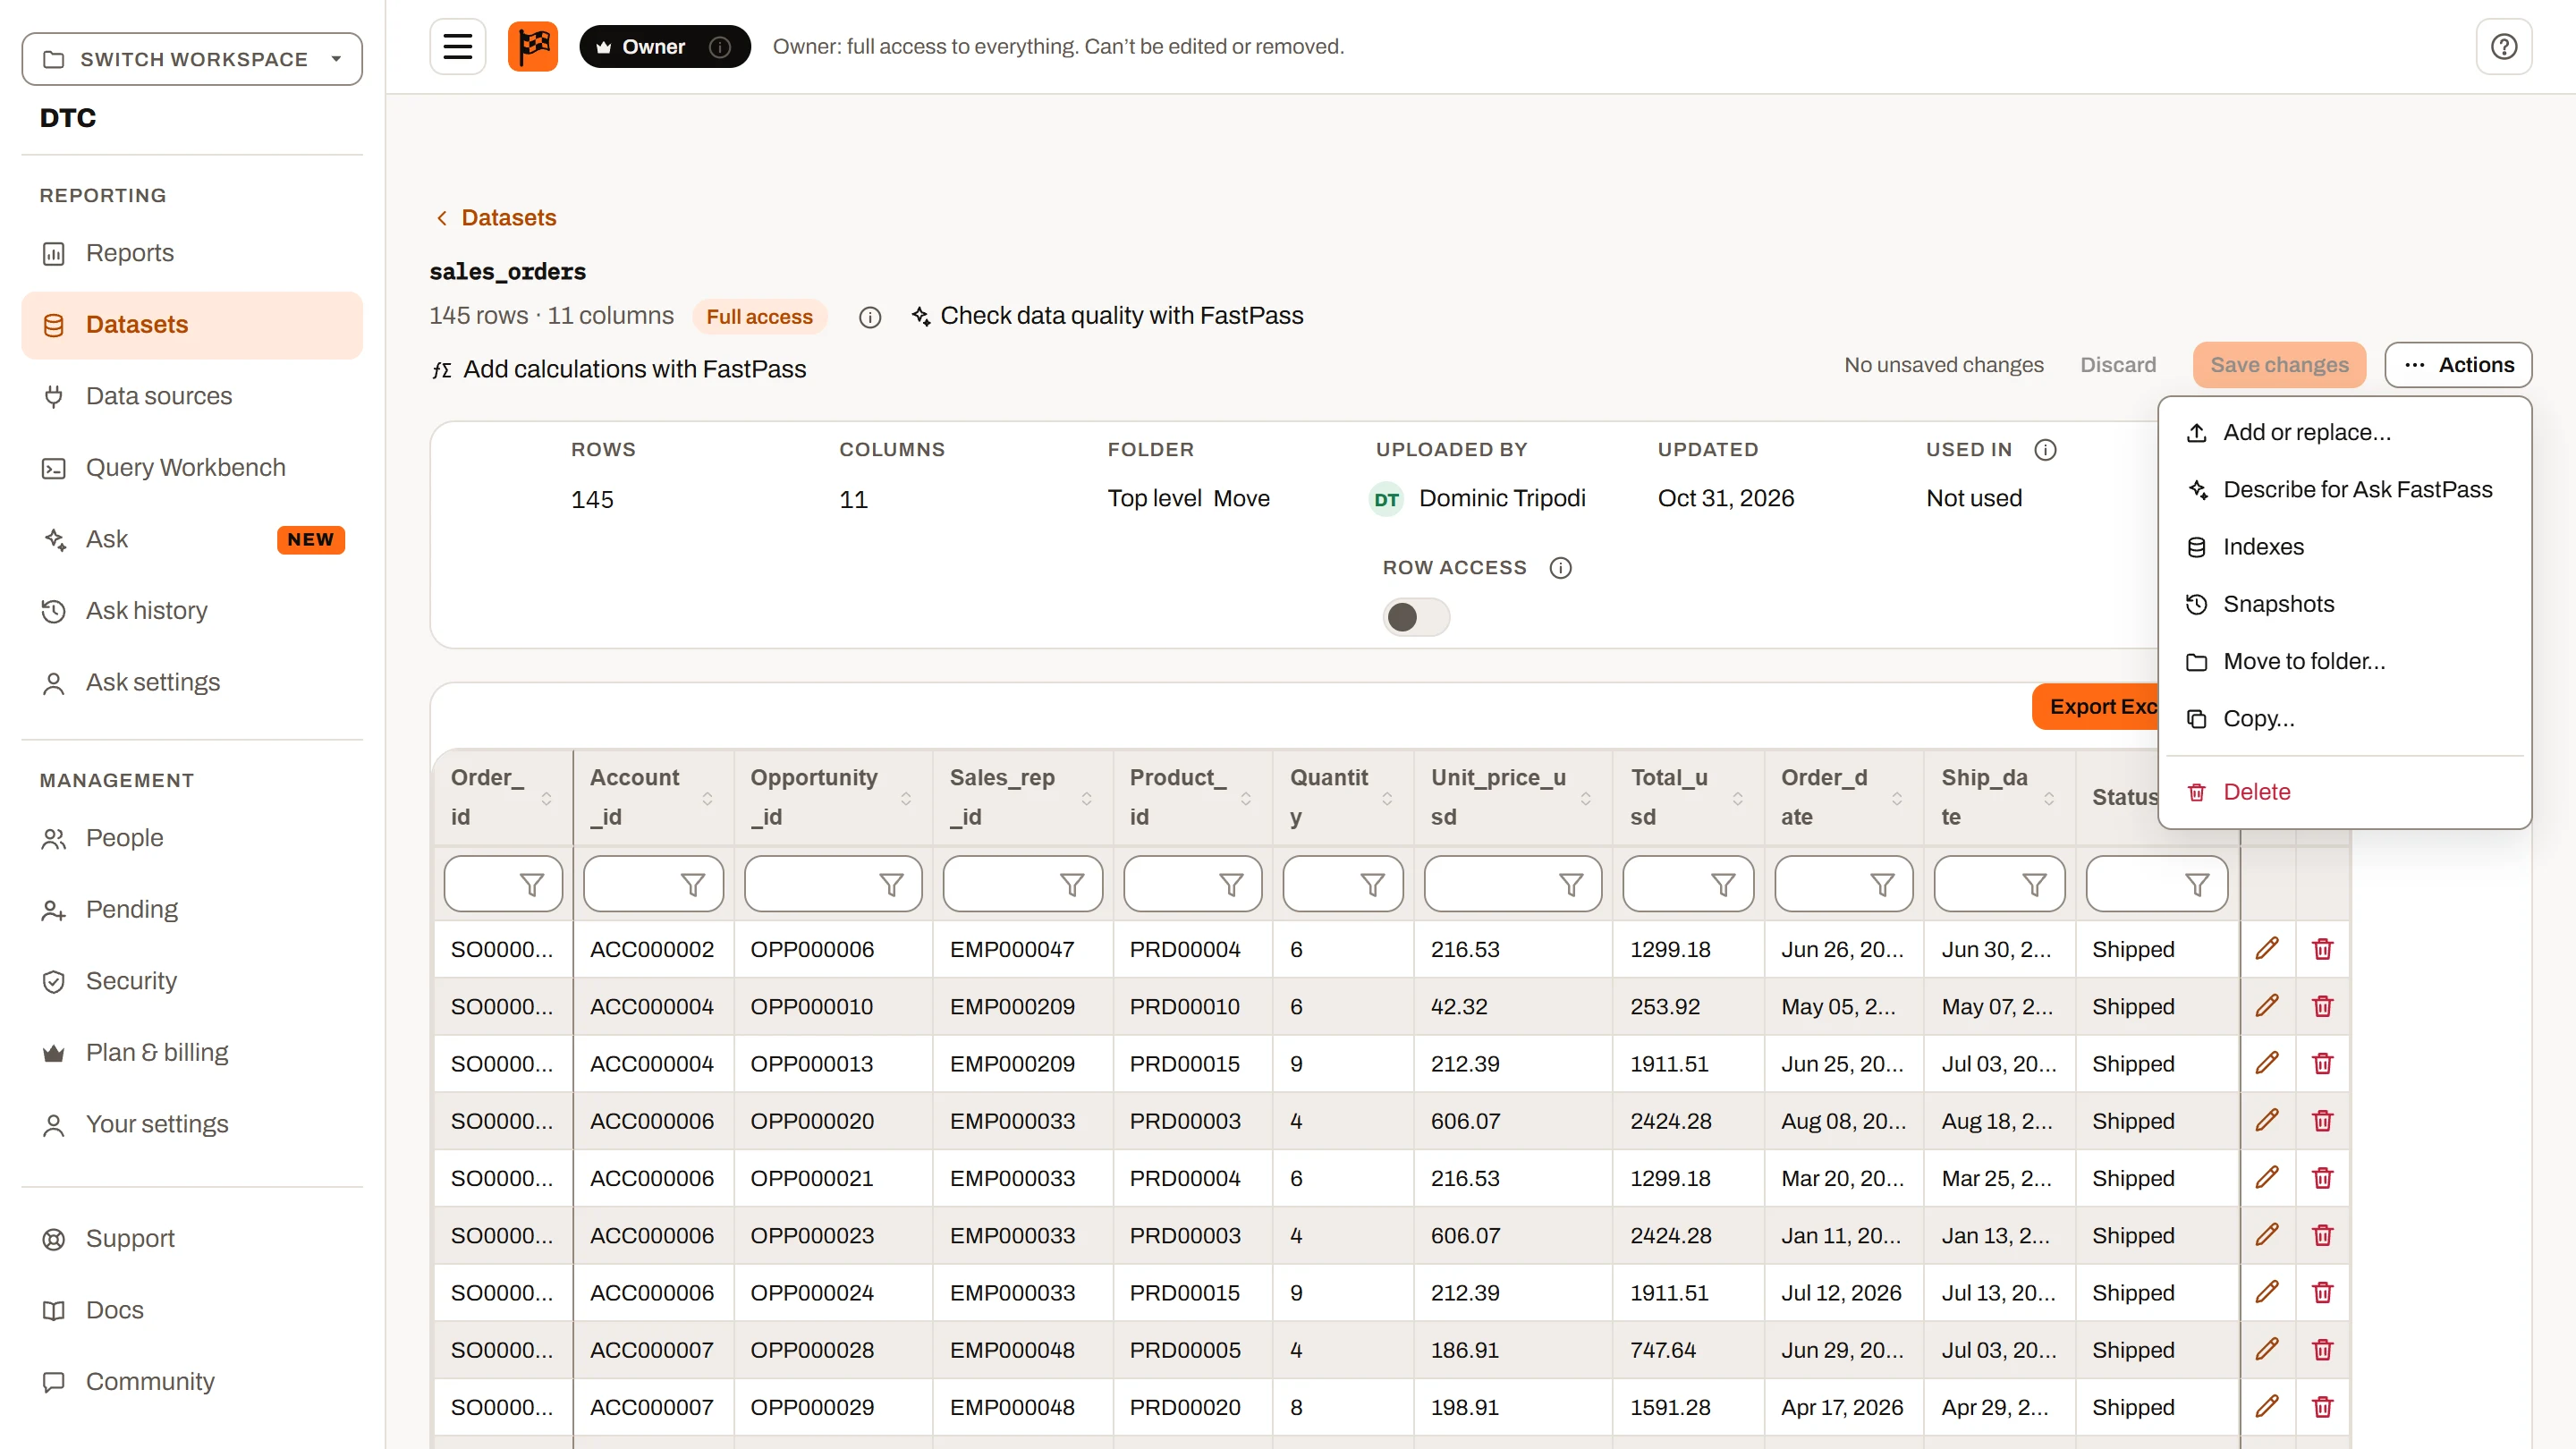
Stay current
Refresh from a database as often as every 15 minutes with the Data sources add-on, or drop next month’s file into the saved report. Open reports update when a teammate changes the data.
Without a premium tier just to refresh more often.
Scheduled refresh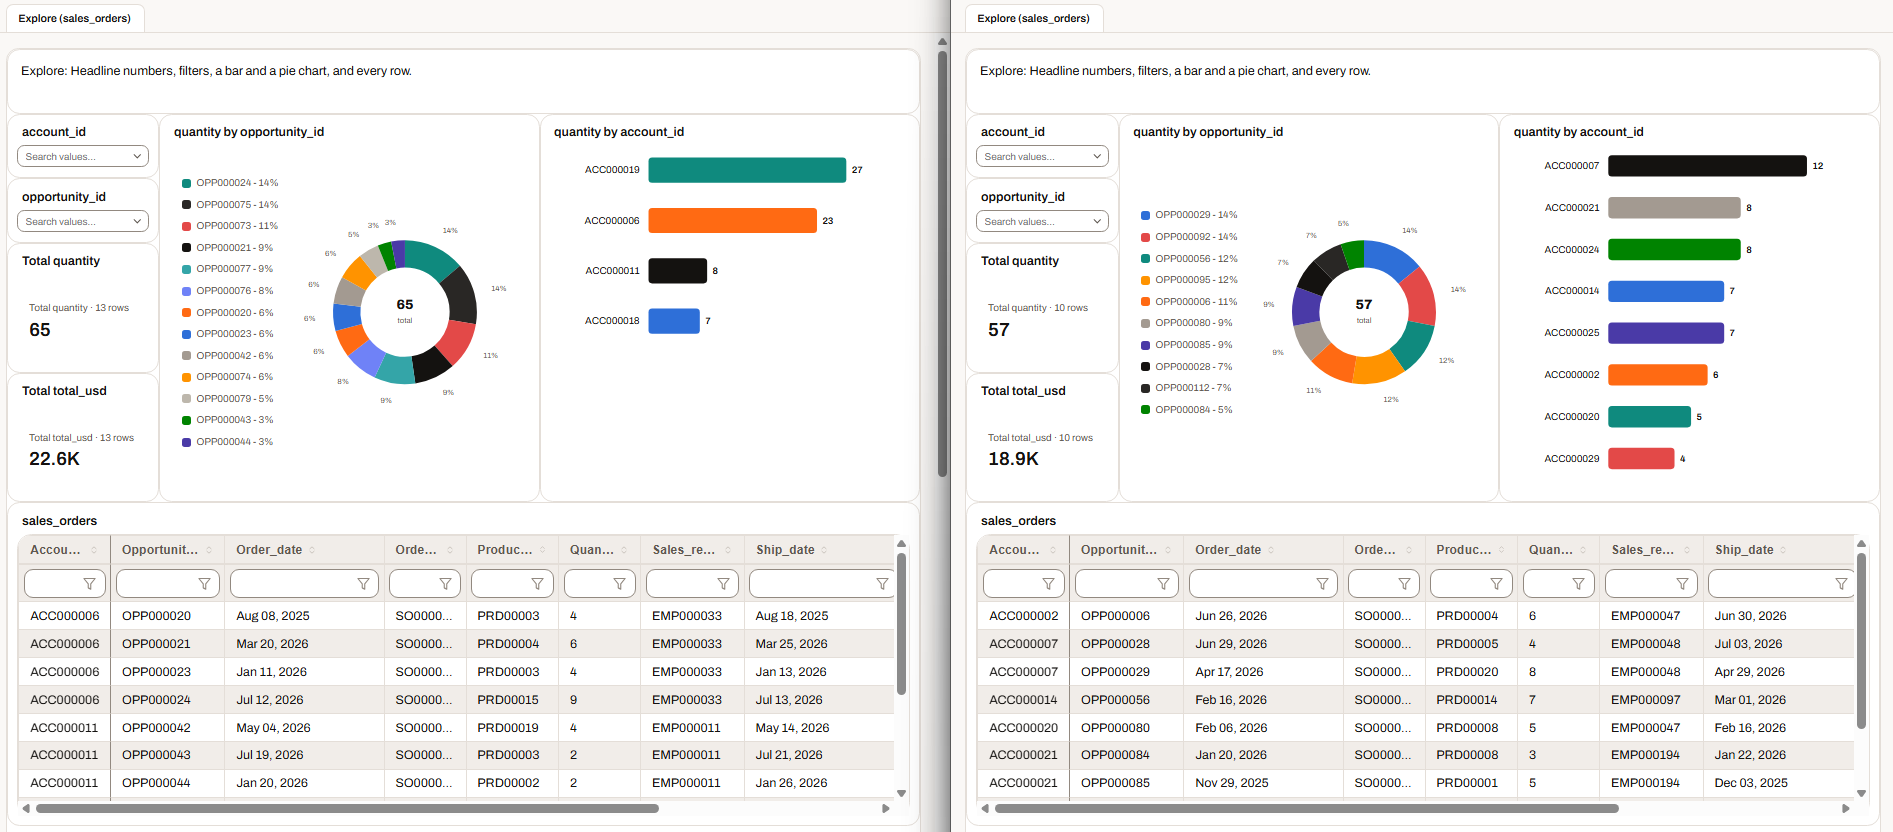
Control
From Plus: roles, groups and shared folders, plus row access that carries through to every report built on the data, and on Ultimate to every shared link too.
Without a license for every person who reads the report.
Sharing & access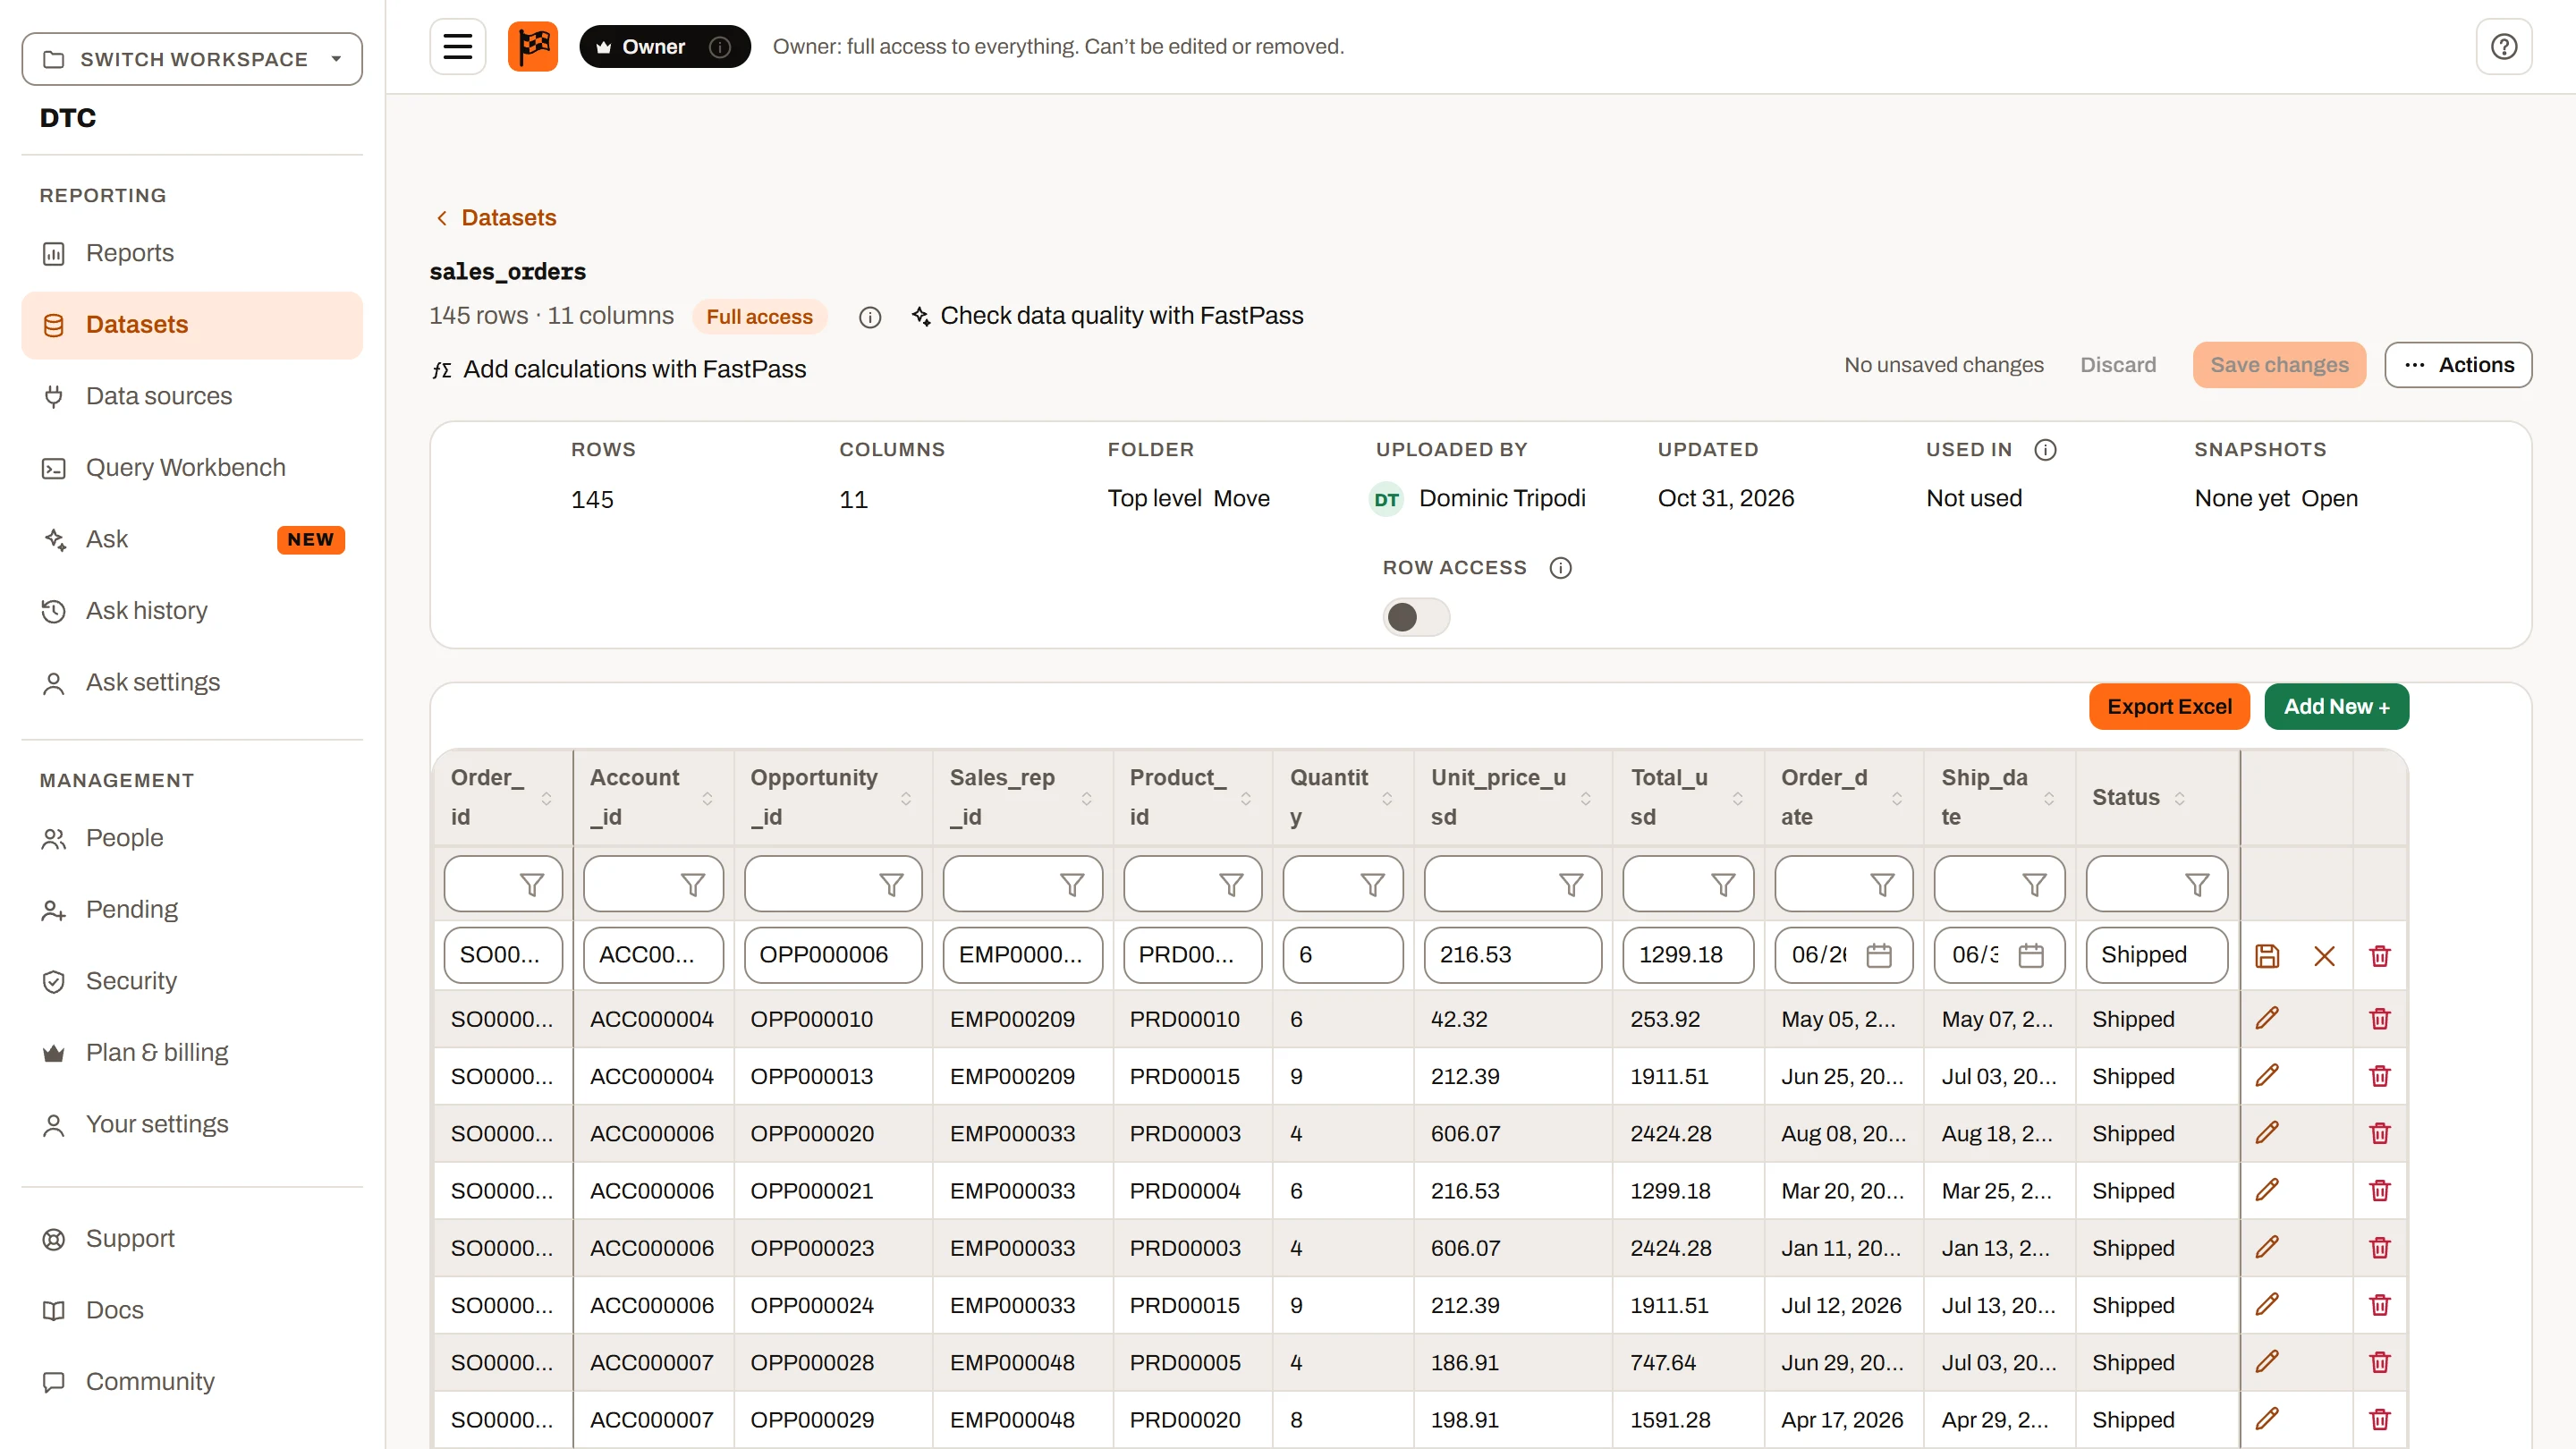
Act
Edit a cell, add a notes column, and export the rows with your changes included, or write them back to your database. The file you uploaded is never touched.
Without a separate app to write data back.
How write-back works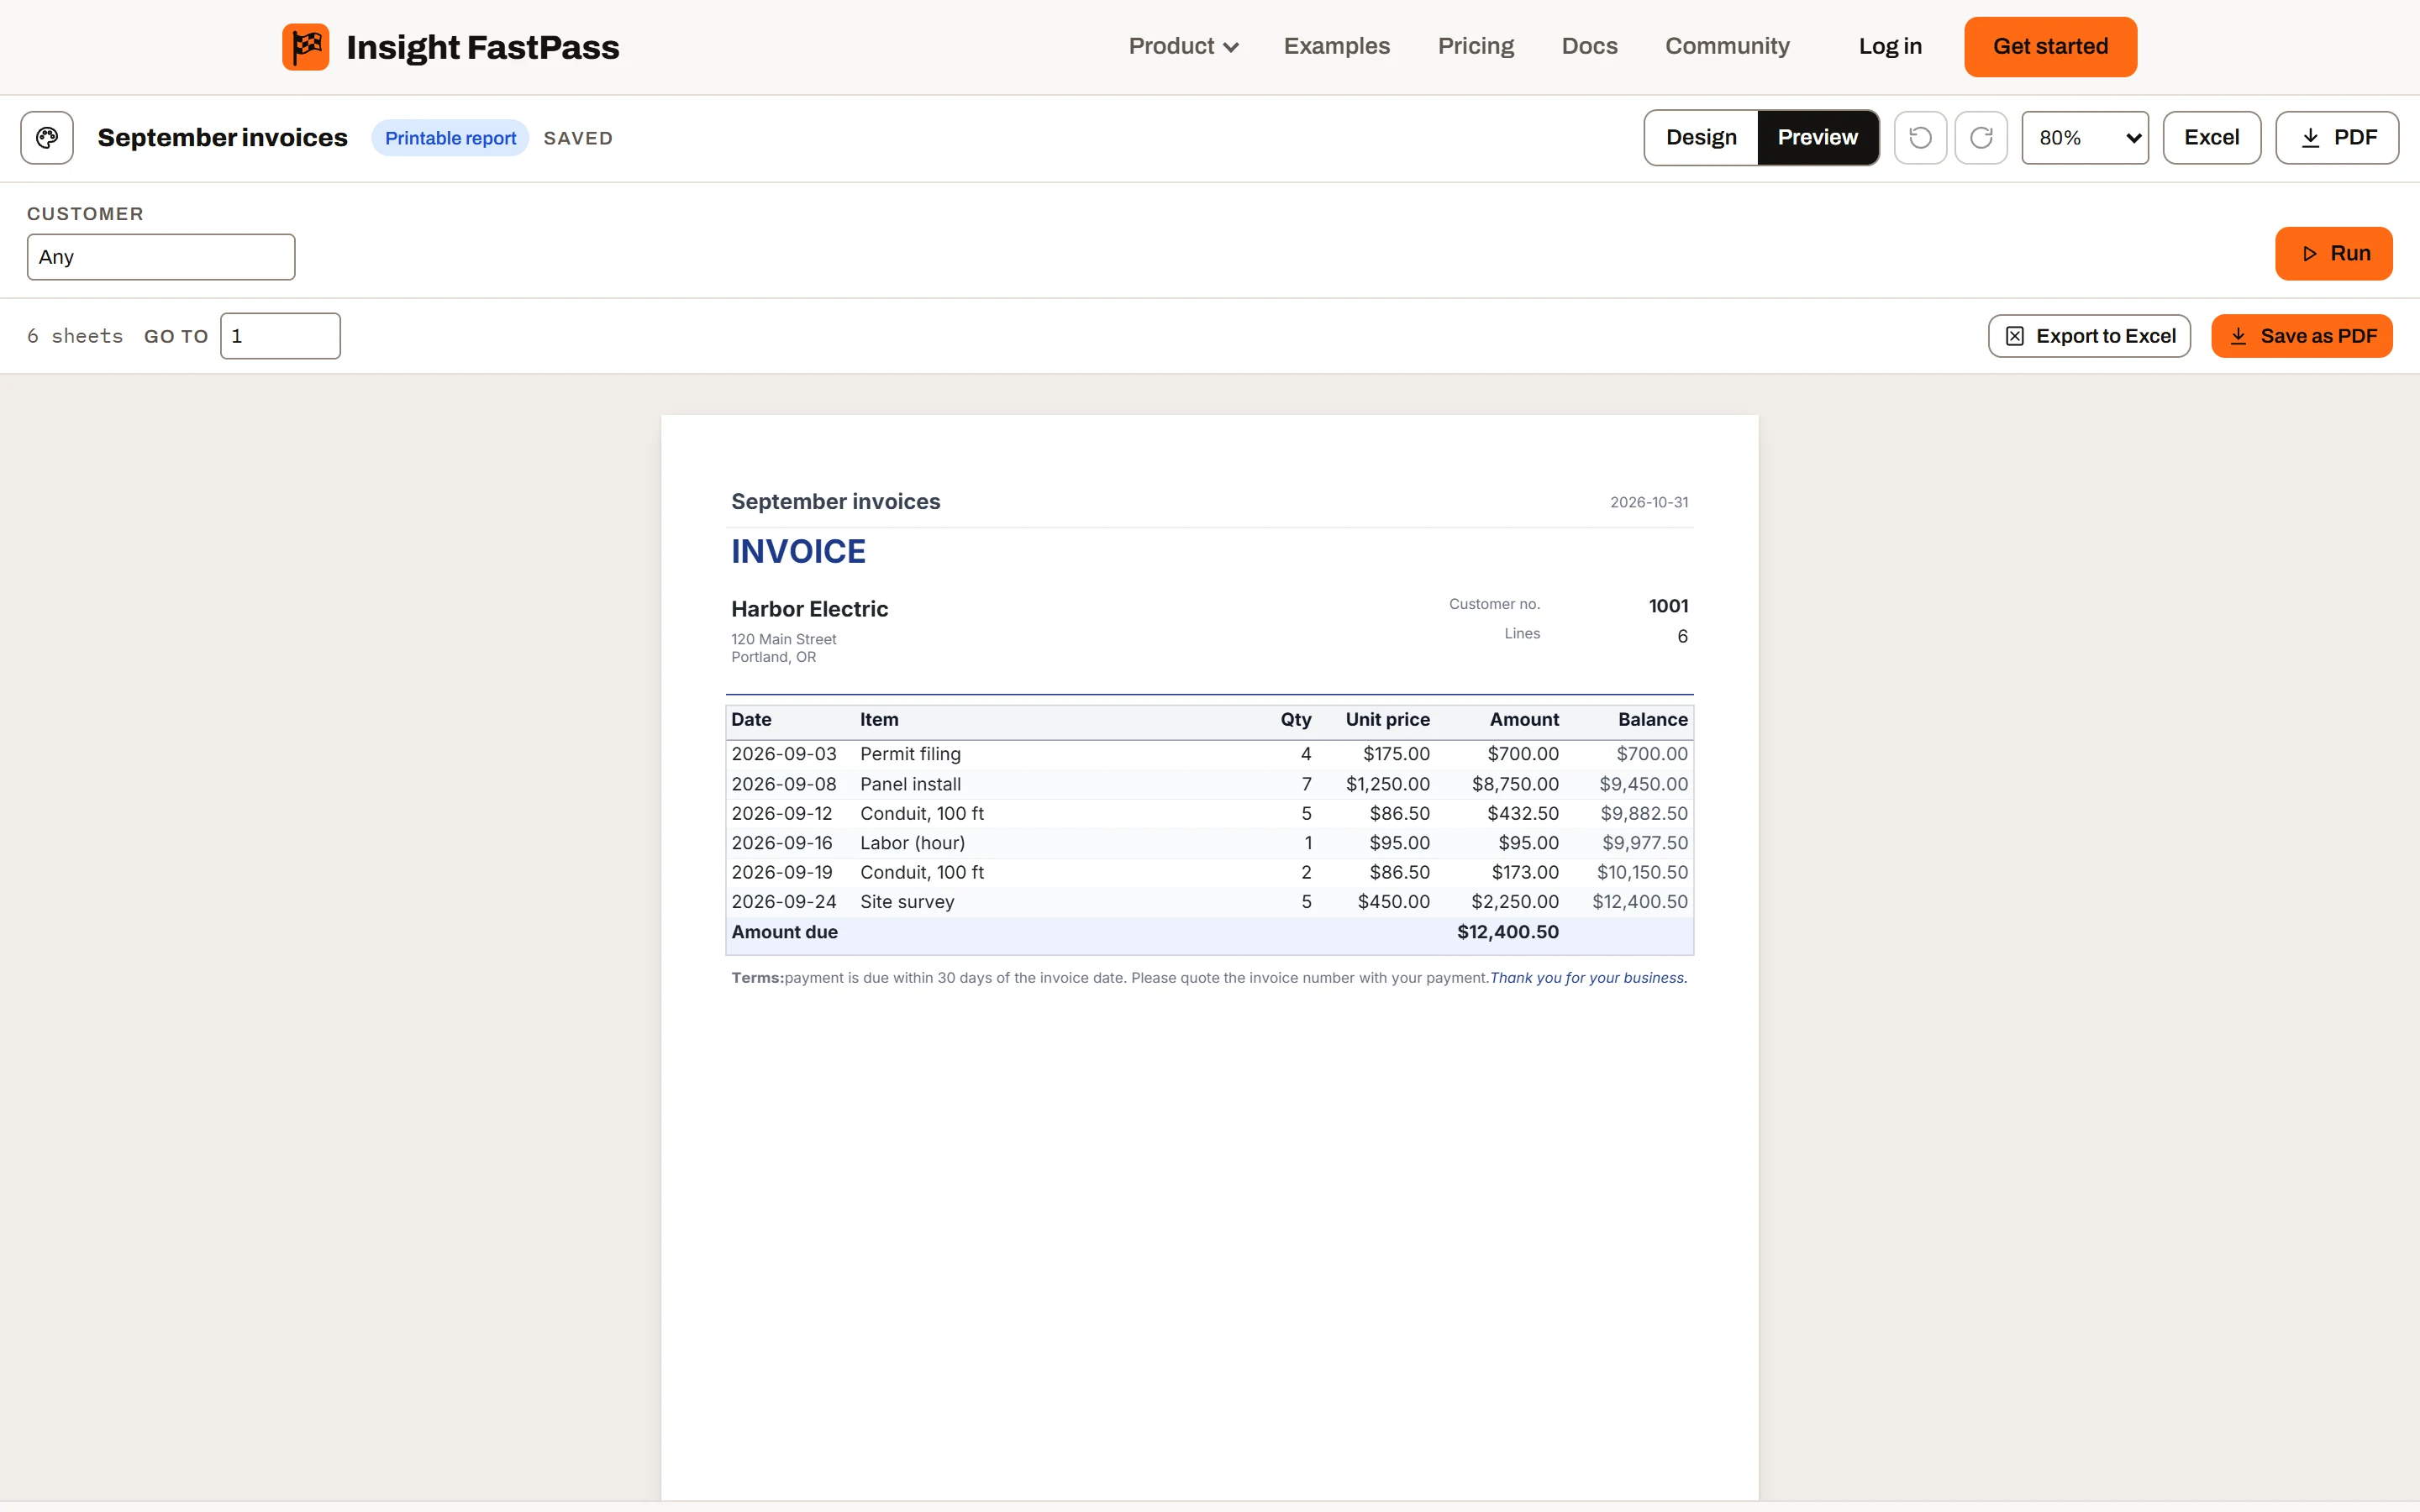
Design a printable report band by band — an invoice, a statement, an aging list — with subtotals, barcodes and a parameter per recipient, and send it as a PDF on a schedule.
Without a second product for paginated reports.
Printable reports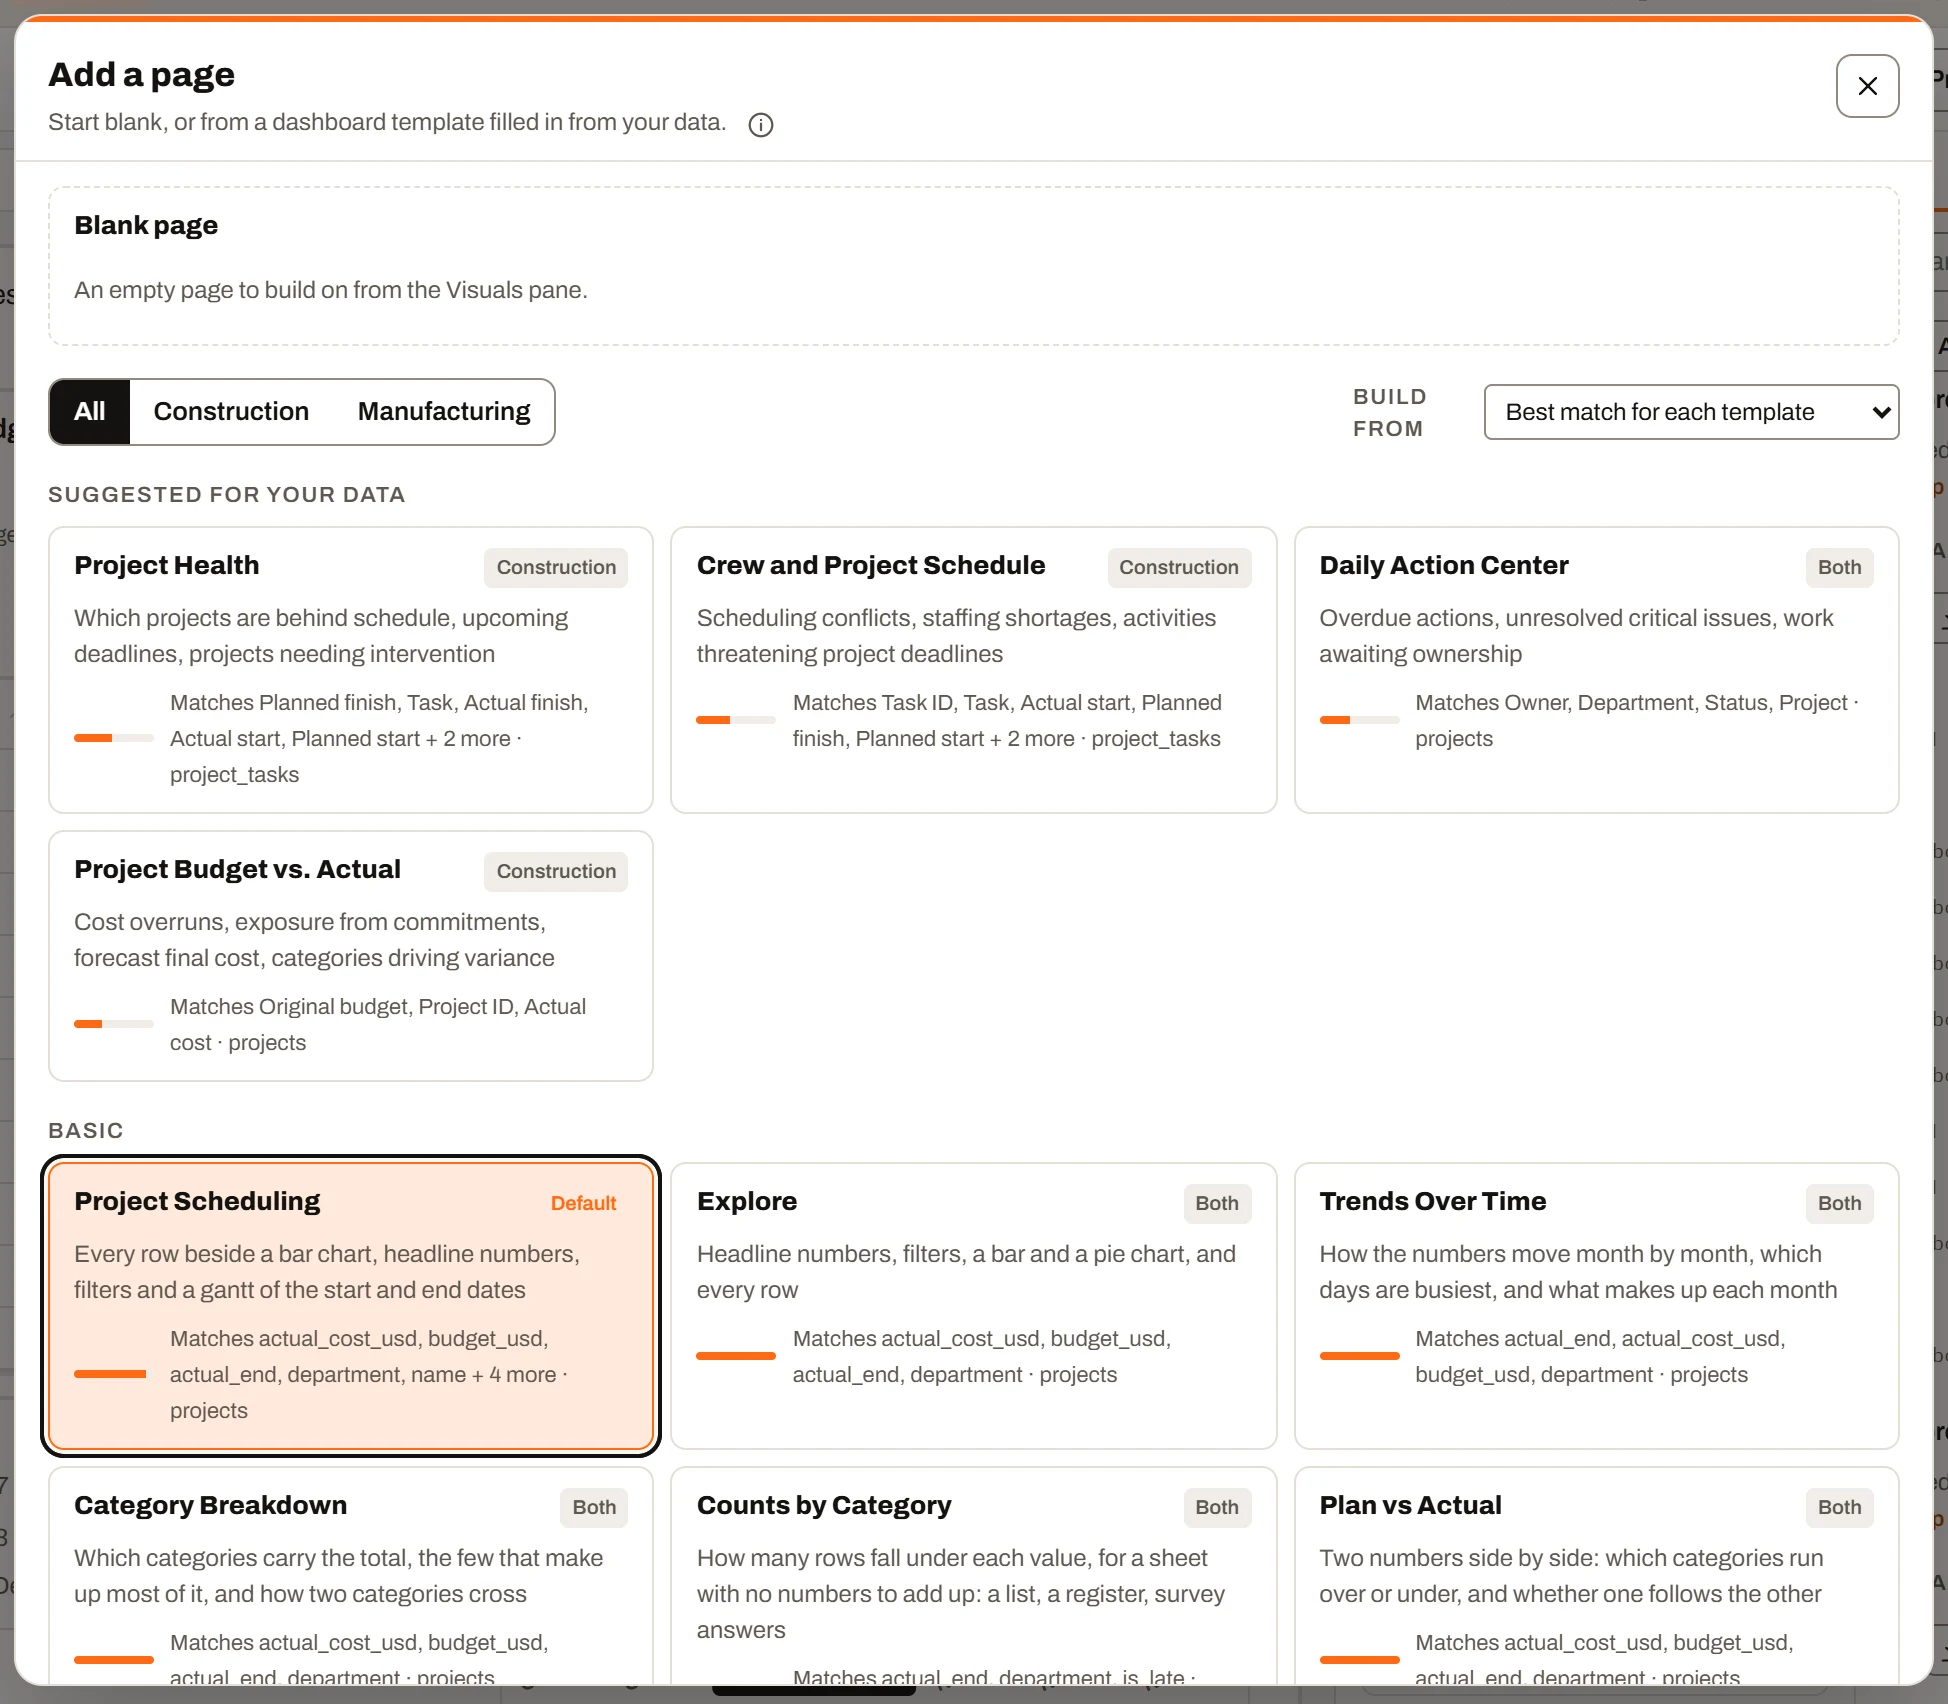
Look
Eight report themes including a colorblind-safe one and a dark one, image and shape tiles for logos and bands, colour scales, and one colour per value across every visual.
Without a designer, or a theme file.
How it worksAsk FastPass Ultimate
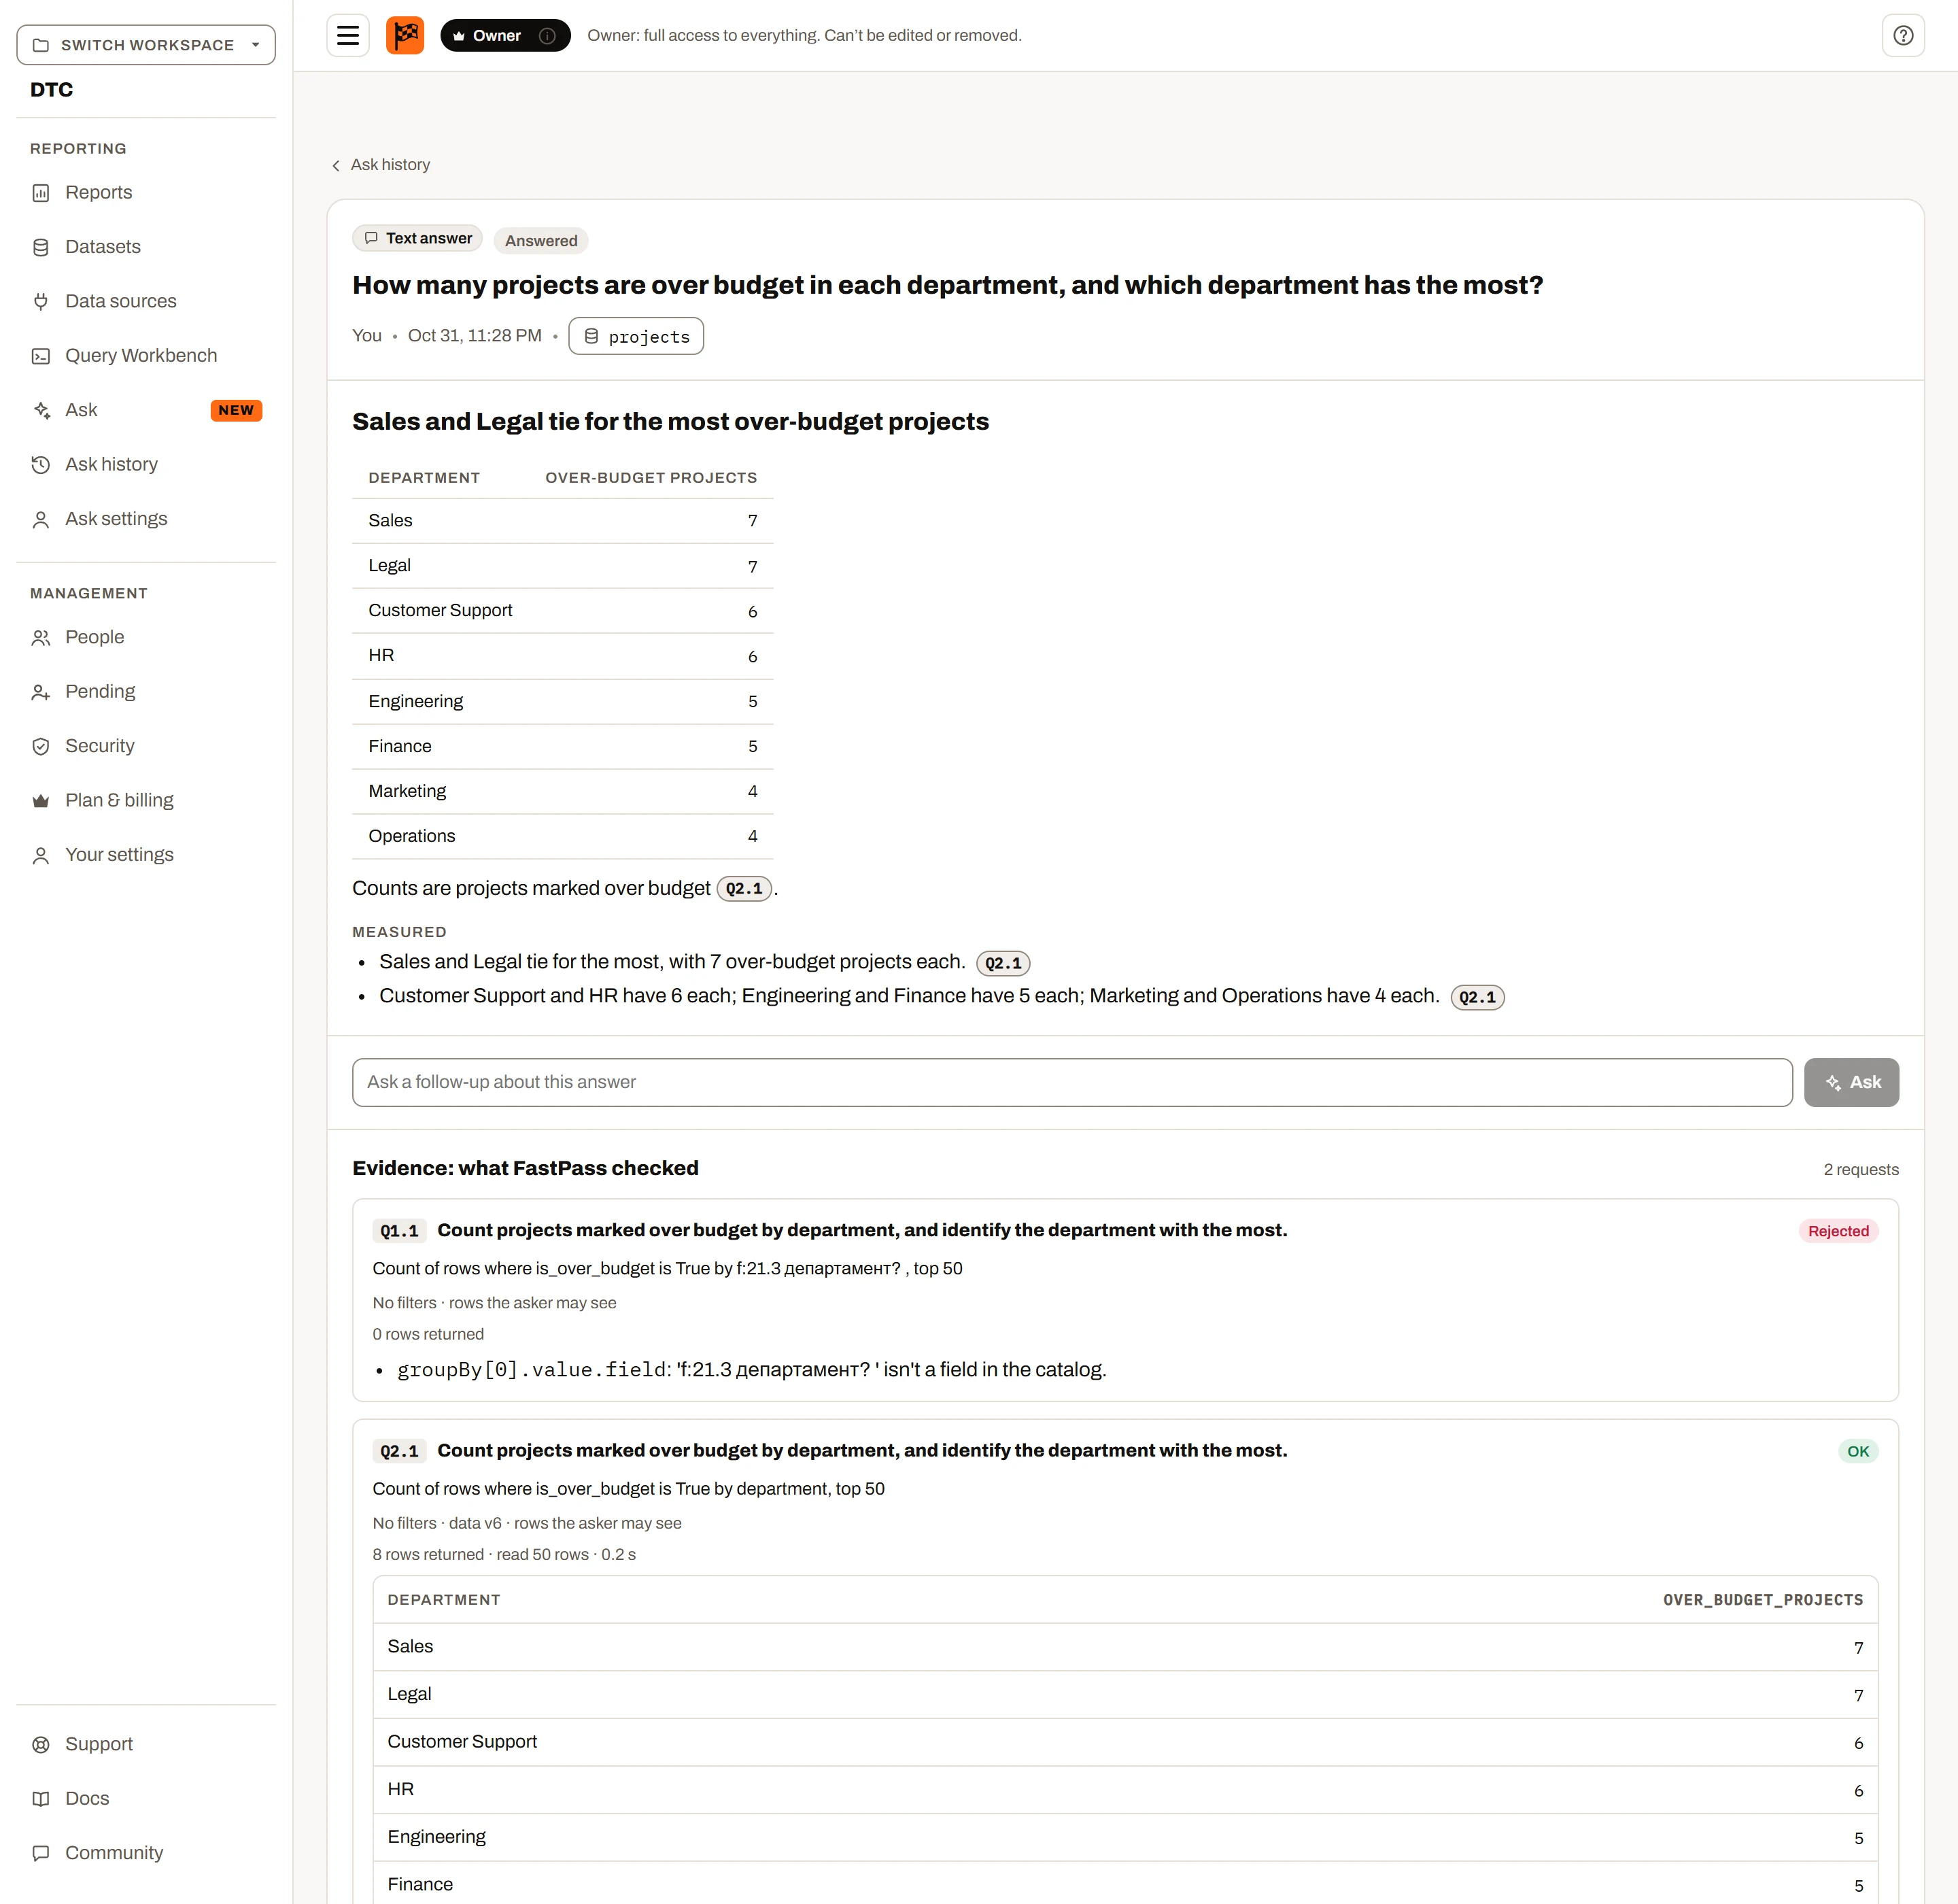
Type a question in plain words. Ask FastPass works out the totals and comparisons it needs, runs them on the rows you’re allowed to see, and shows its evidence. It can also explain a report page, check a dataset for problems, or build a page for you.
Try it free with no account: drop in the file and have your first dashboard in minutes. Save it, share it or connect a database when you’re ready — or read your database from the free desktop app today.