
Calculated field
A new column, worked out per row
Margin, days late, a due date from the customer’s payment terms.
DATEADD([Invoice Date], Customers[Payment Terms], "day")BetaFree accounts and the desktop app are available now. Paid plans, with reports on the web, sharing and live connections, launch once enough people ask for them. Express your interest
Calculations & queries
Available now in the desktop app Calculated fields, Summary Calculations and the Query Workbench all work in the desktop app today. Snapshots over time come with the full release.
Most reports need no formula at all: pick the columns and Insight FastPass does the sums, averages and groupings. When you need more — a running total, a change on last month, a value from a linked table — one spreadsheet-style language does it, with autocomplete and a hint for every argument.
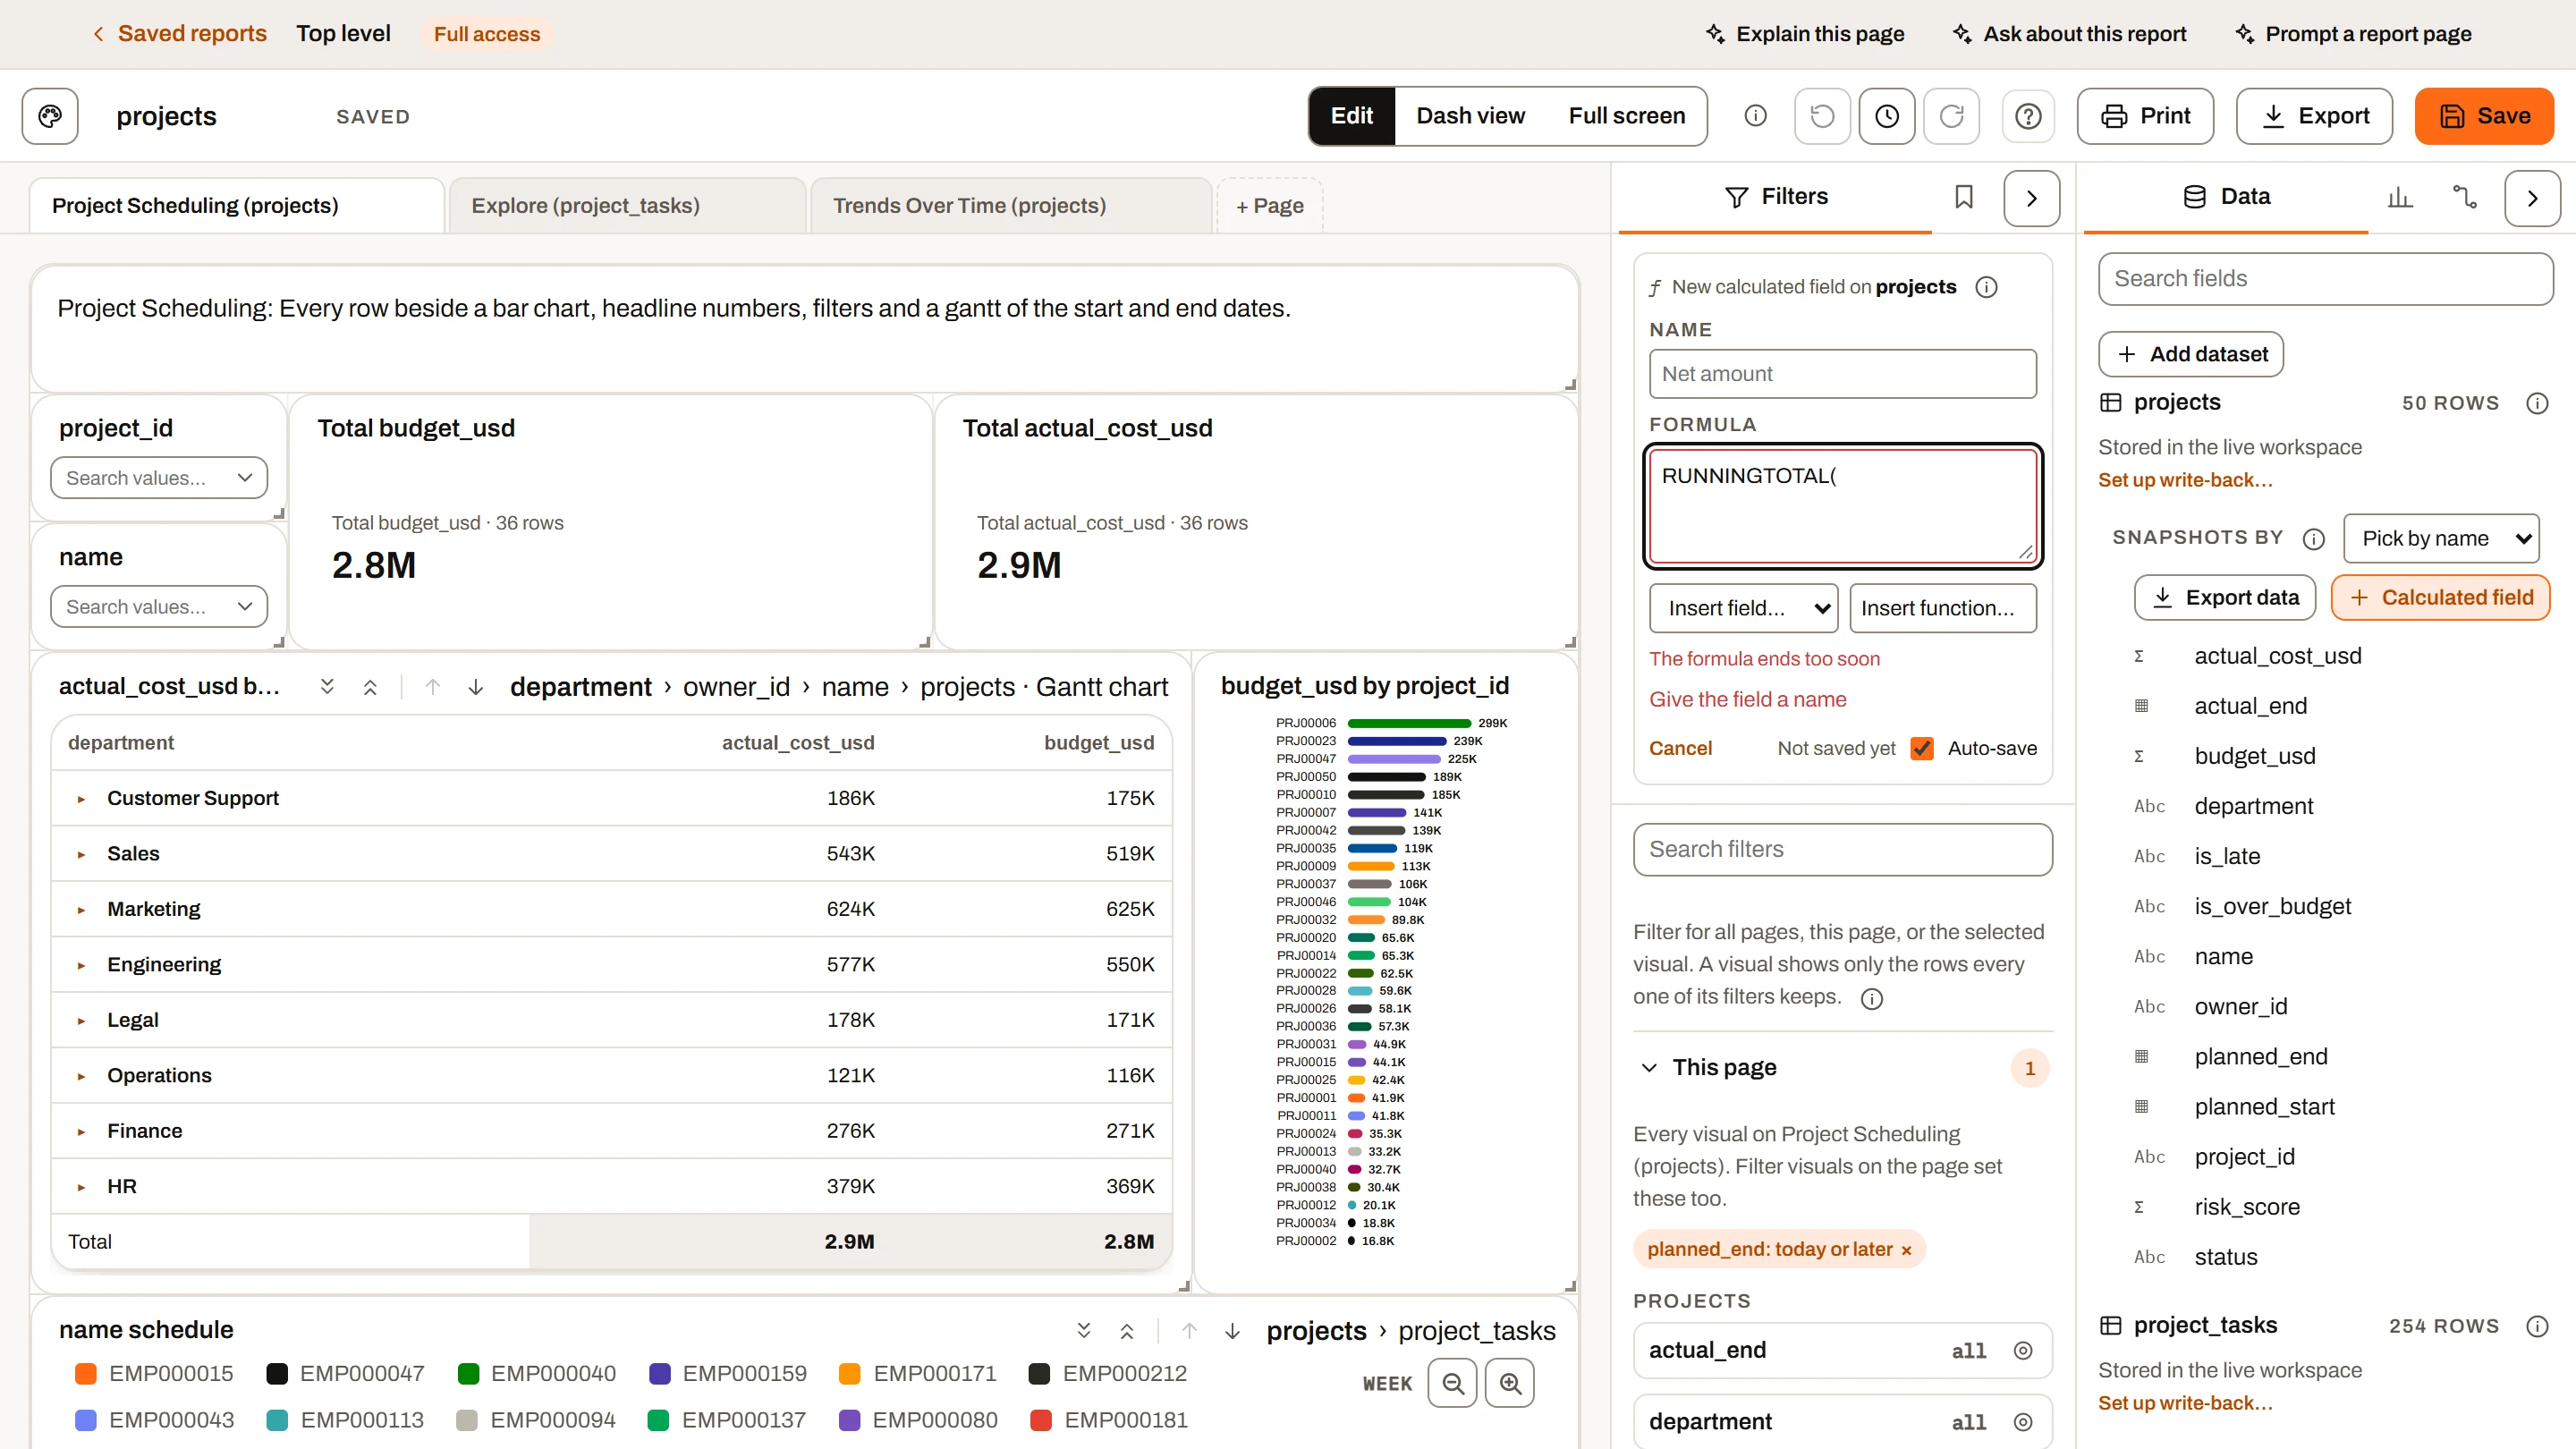
One language, three places
The functions, the rules about blanks and the way you write a column are the same wherever a formula goes. What changes is which rows it can see.
Calculated field
Margin, days late, a due date from the customer’s payment terms.
DATEADD([Invoice Date], Customers[Payment Terms], "day")Summary Calculation
Running totals, change on the previous period and rank, worked out across the visual’s categories.
SUM([Sales]) - PREVIOUS(SUM([Sales]))Styling rule
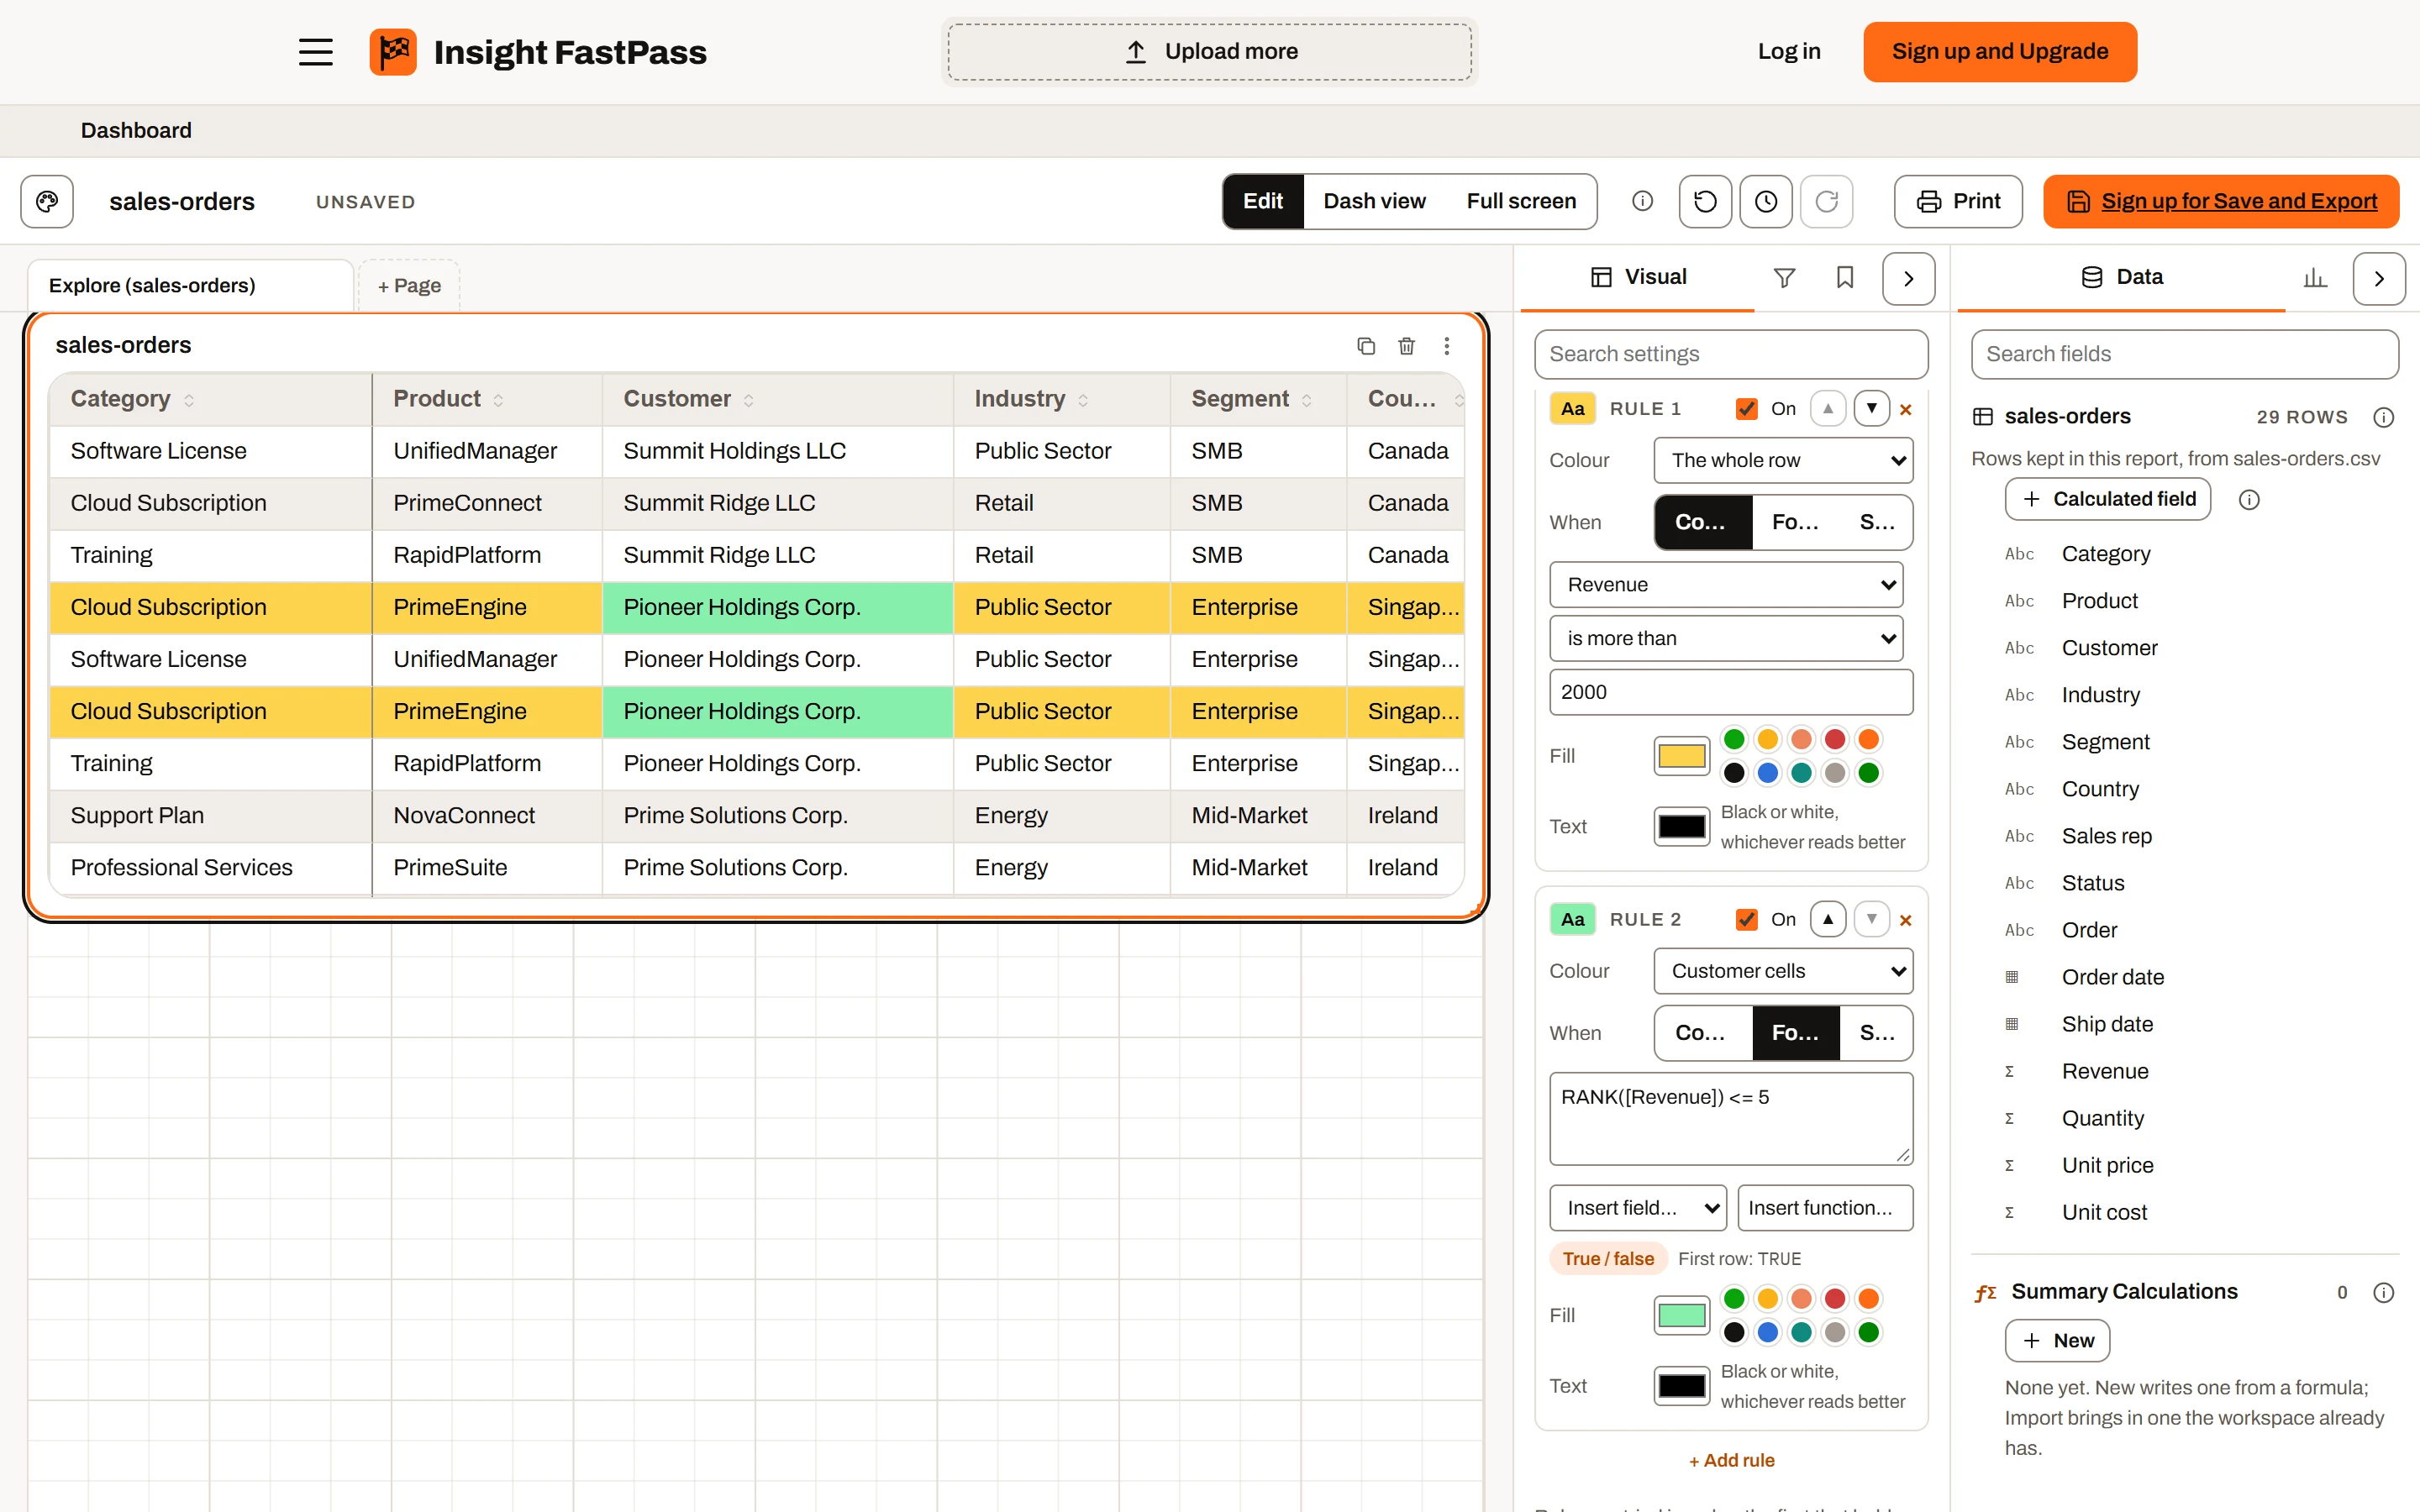
Color a cell or a row when the formula holds, as conditional formatting does in Excel.
[Promise Date] < TODAY()The ones people ask for
Added up in the order of the axis.
RUNNINGTOTAL(SUM([Sales]))Blank for the first period.
SUM([Sales]) - PREVIOUS(SUM([Sales]))1 for the largest.
RANK(SUM([Sales]))Any column of a linked dataset.
Customers[Region]No formula needed
Show as percent of total, roll up by sum, average, count and more, add a target line, flag values above or below a threshold, keep the top 10 and fold the rest into “Other”. Number and date formats are set once on the column, and every report shows them that way.
For the analyst Plus & Ultimate
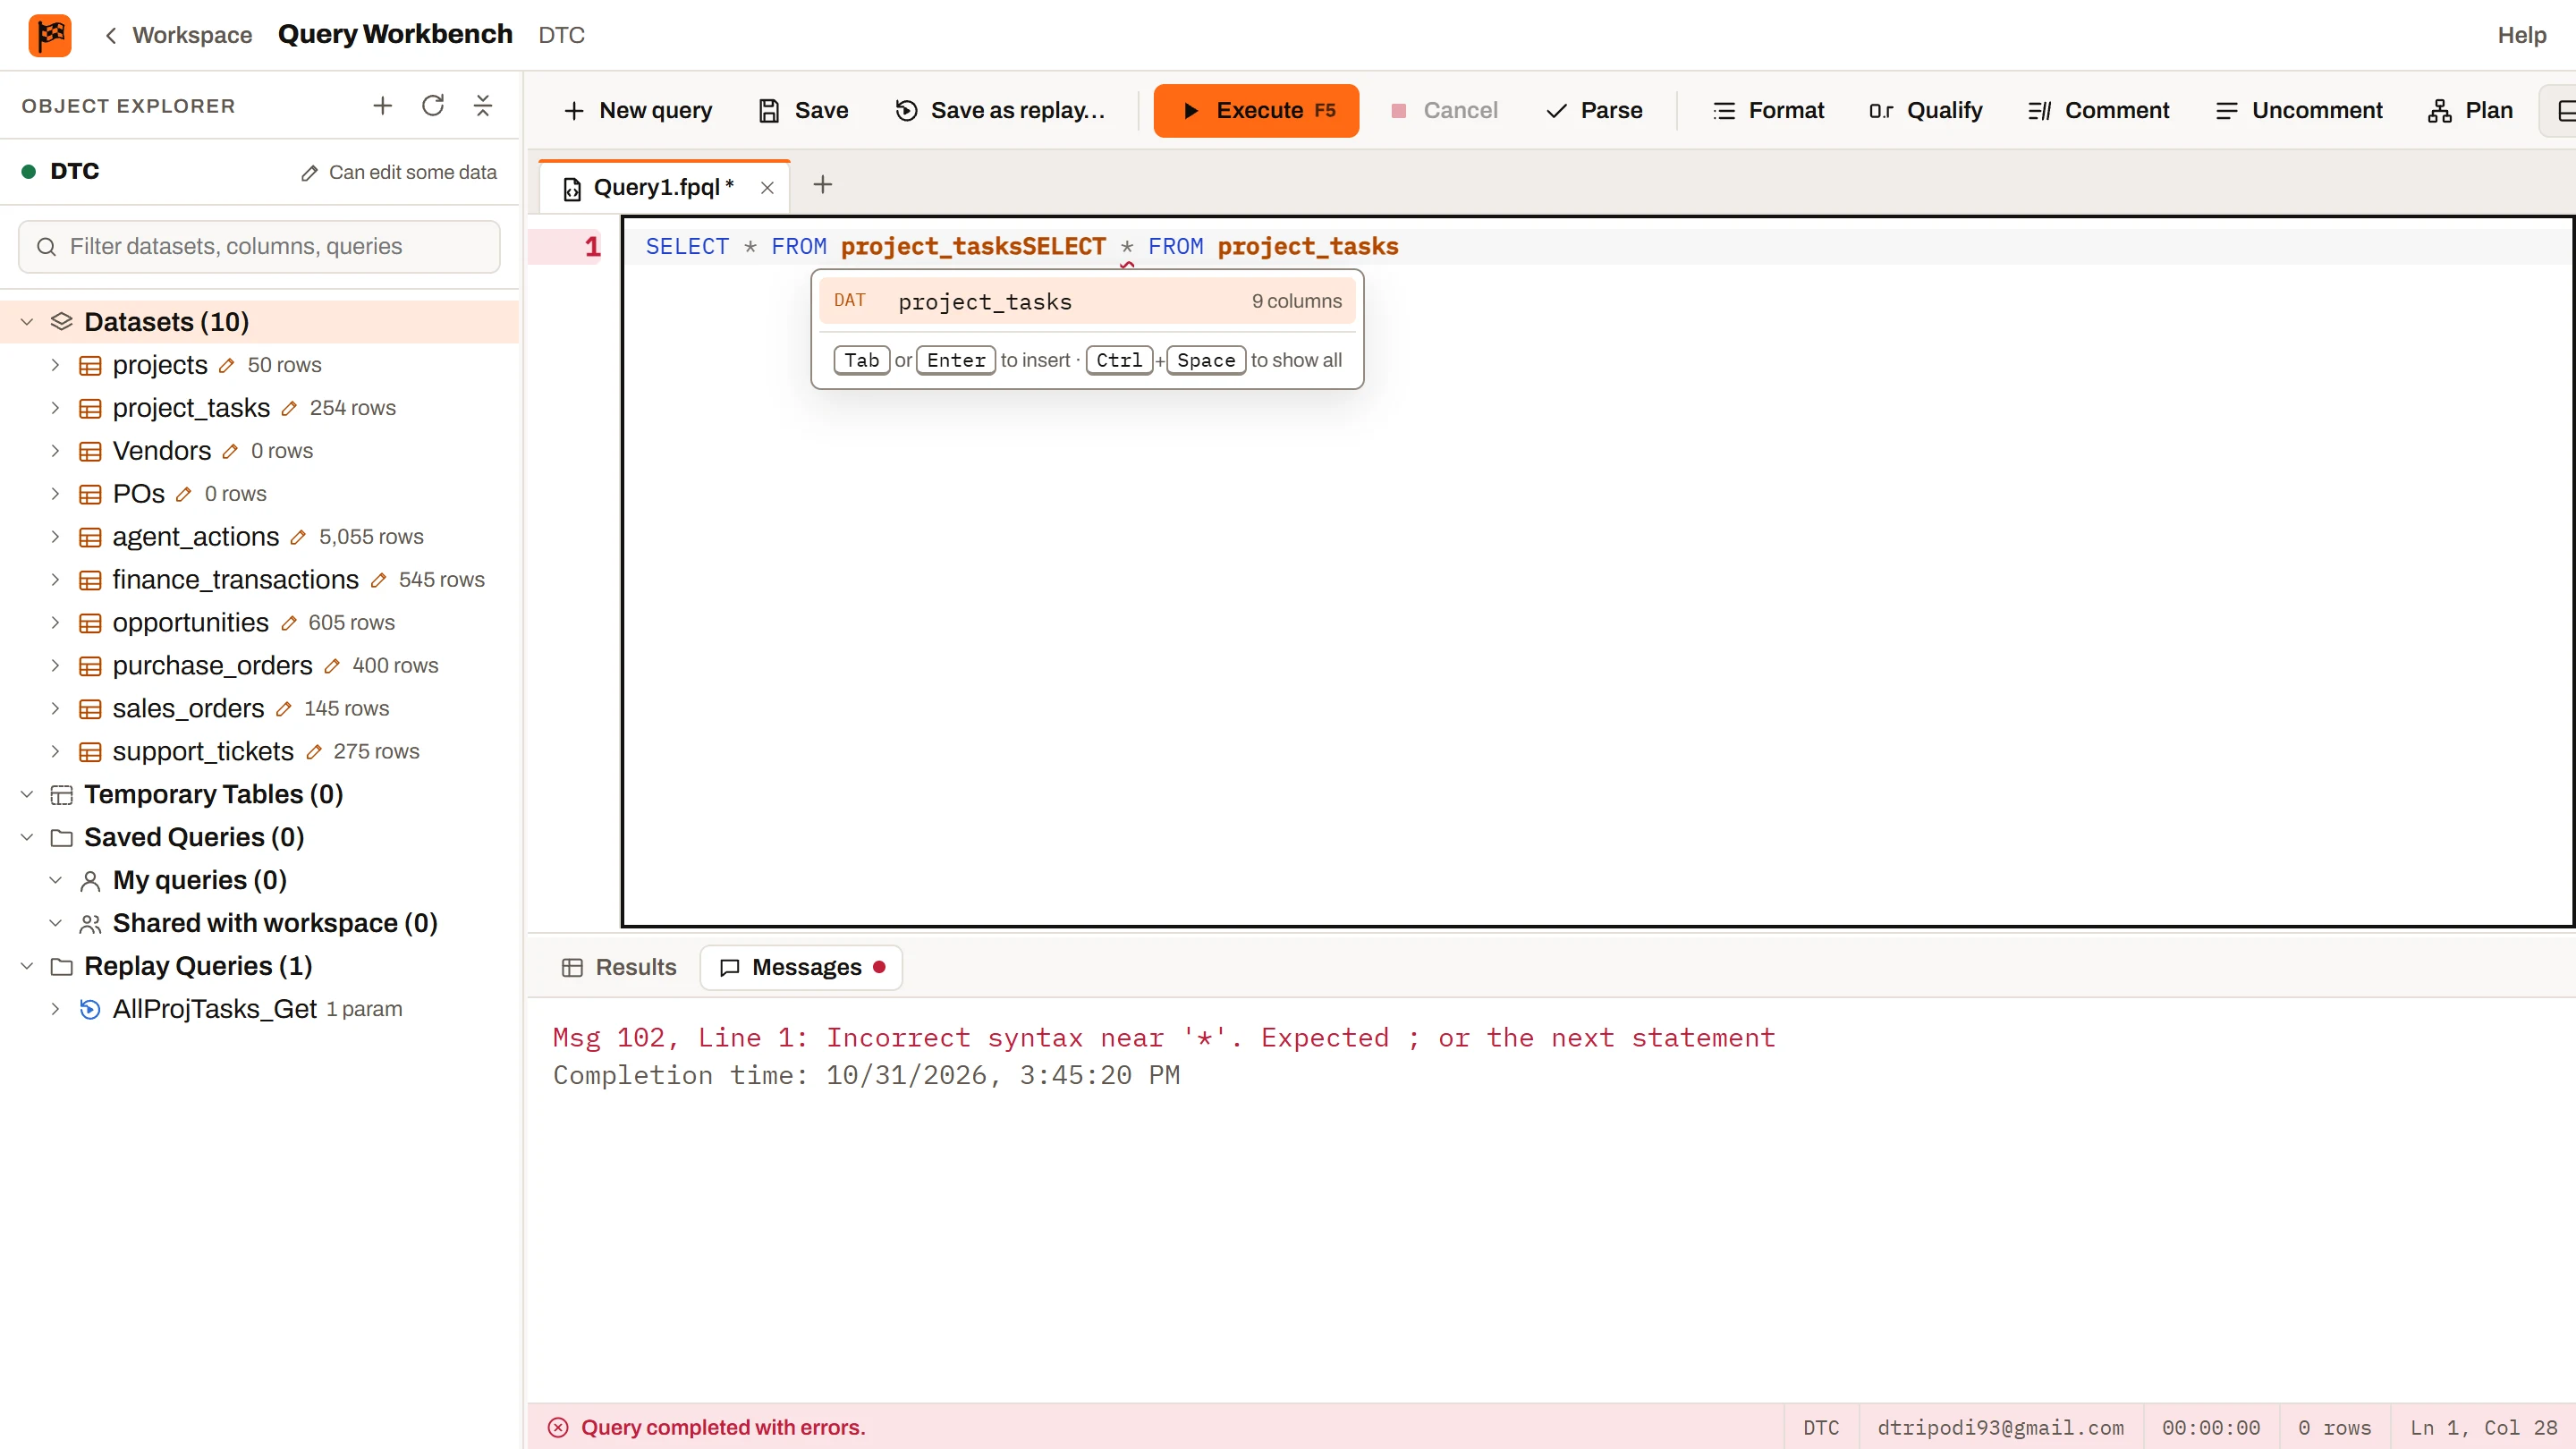
The Query Workbench works like the query window you already know: an Object Explorer on the left, query tabs on the right, results underneath, F5 to run. FPQL is shaped like SQL, and everything inside it is the same formula language as the reports.
Reports use it like any other dataset, and it re-runs by hand or on a schedule — so the cleanup you wrote once runs again on its own.
Combine datasets, keep steps in temp tables, and on Ultimate save replay queries that take parameters.
SELECT o.JobID, c.CustomerName
FROM #Open AS o
JOIN Customers AS c ON c.CustomerID = o.CustomerIDUPDATE, INSERT and DELETE on a dataset, for the people allowed to change it.
The FPQL referenceAn execution plan and index advice for a slow query, saved queries shared with the workspace, tabs that are still there tomorrow, and the keyboard shortcuts you already use, column selection included.
Over time Ultimate
Many systems export a list as it stands today: open orders, a backlog, balances. Keep each export as a dated snapshot in one dataset, and a chart shows how it moved — no history tab to maintain.
Styling
Add conditional styling to any grid with a condition, a formula or a colour scale from low to high. Each grid keeps its own rules, every change can be undone, and nested grids get rules of their own. Heat maps, calendars and region maps take a colour scale too.
No. Totals, averages, counts, percent of total and top-N are settings on the visual. Formulas are there for what those don’t cover.
All of them, Free included. The Query Workbench is on Plus and Ultimate, for editors and up; snapshots are on Ultimate.
Yes. Import a Summary Calculation from another report in the workspace, and a calculated field lives on the dataset, so every report on it has the column.
It should: SELECT, FROM, WHERE, GROUP BY, ORDER BY, joins, subqueries and temp tables. The guide has a “Coming from T-SQL” section for the differences.