
Share with specific people
For clients, your team, partners and the board
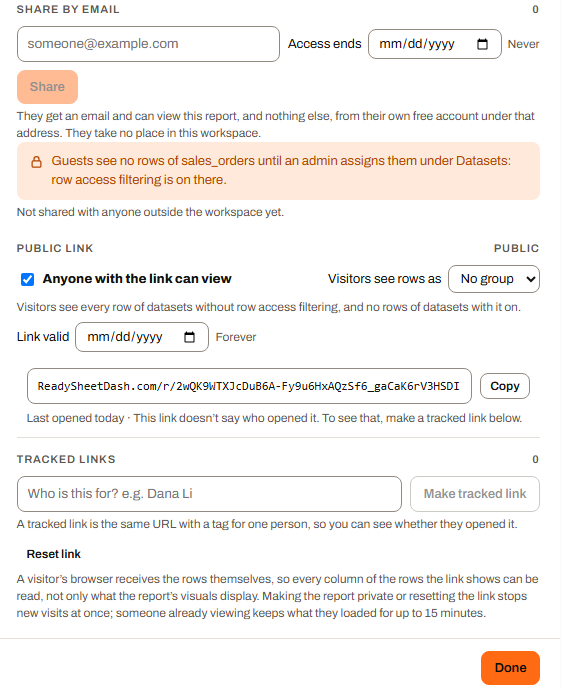
Add anyone by email. They don’t need a seat in your workspace — just a free account under the address you shared with. Two ways to hand it over:
BetaFree accounts and the desktop app are available now. Paid plans, with reports on the web, sharing and live connections, launch once enough people ask for them. Express your interest
Sharing & access Ultimate
Coming soon Sharing comes with the full release. In the desktop app today, share a library in a network folder with your team, or send a report as an .ifpr file. The full release launches once enough people ask for it. Express your interest
Share a report by email with your team, a client or the board: they open it from their own free account, nothing to install. Or switch on a view-only link and paste it wherever the conversation already is — no account needed for that.
Sharing by email and public link is included with Ultimate, from $99 a month. Folder and report access, groups and row access start on Plus.
Ultimate
Free, unlimited sharing with the Ultimate plan.
Share a report with as many people as you like. Visitors on a public link need no account at all, and people you invite by email open the report from a free account. Only the person sharing needs Ultimate, so you know what the whole audience costs before you build anything.
Three clicks
Open Share & permissions from the report’s row on Saved reports. No admin console, no separate publishing step.
Type an email address and they get the report under Shared with you, from their own free account. Or switch on the view-only link and copy it. Either way, it takes under a minute.
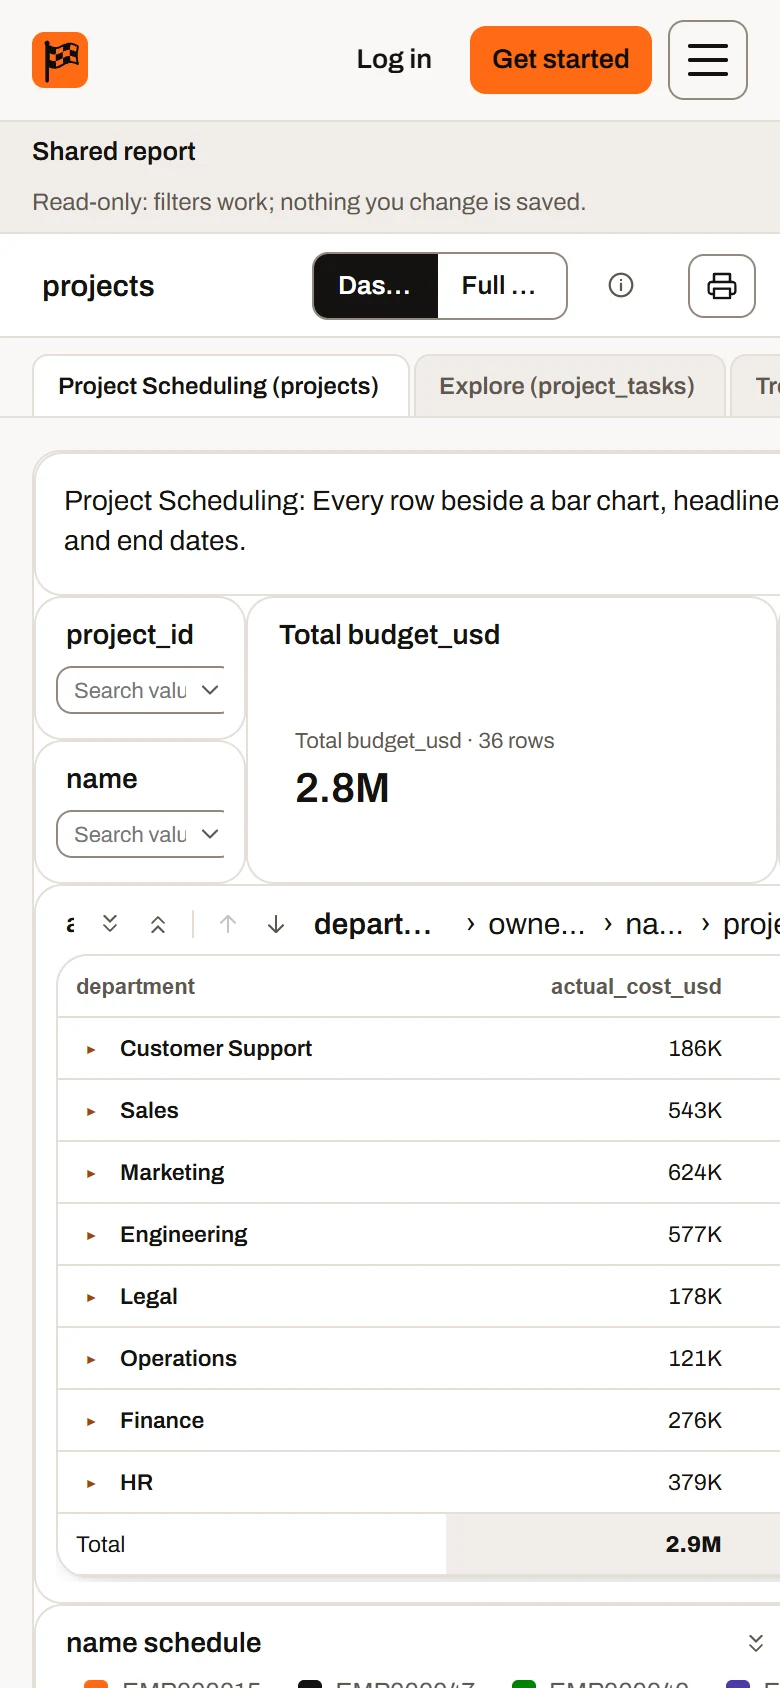
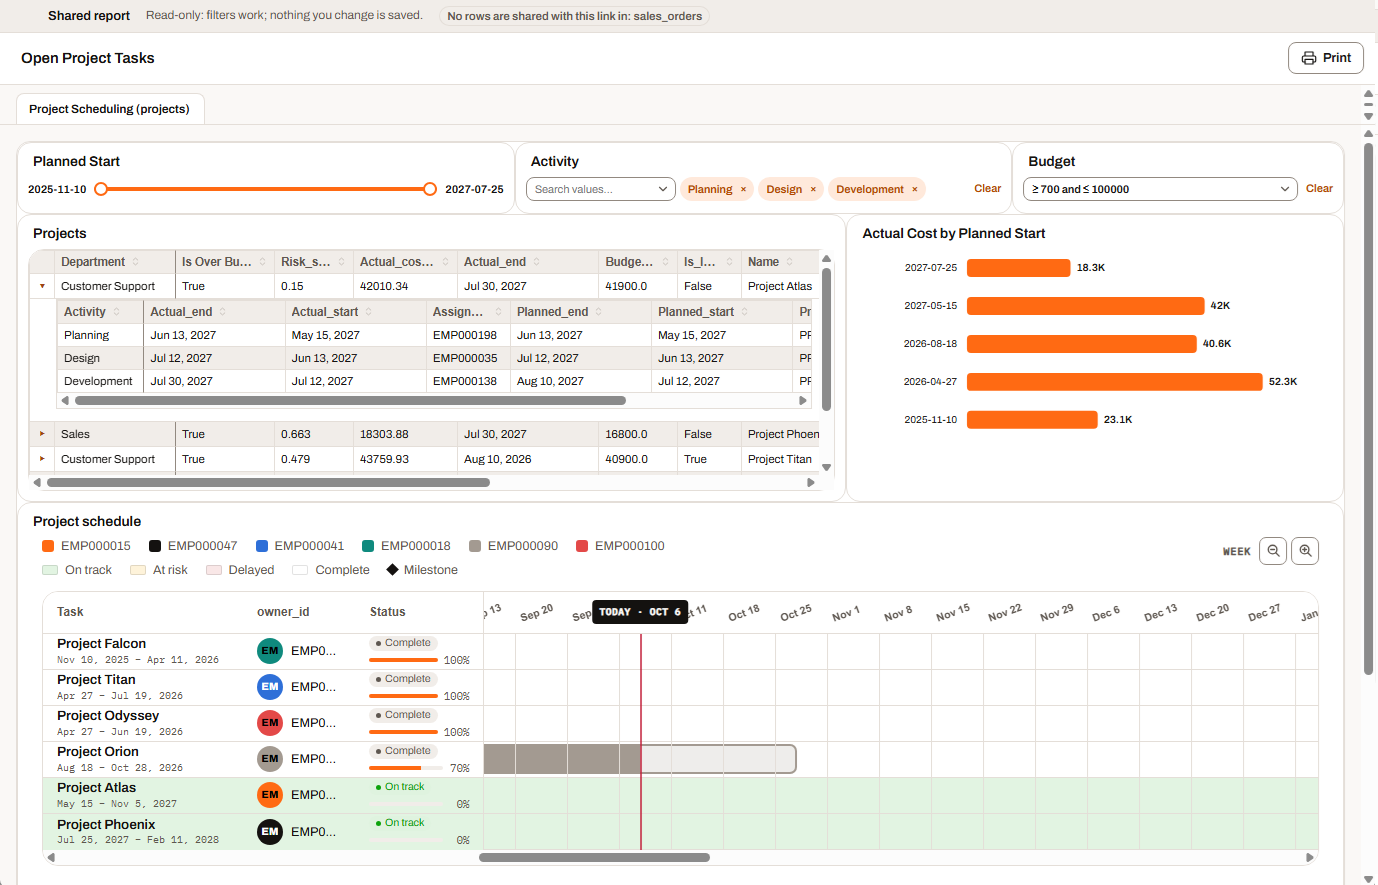
Viewers get the dashboard in their browser, on any device, with every filter and drill-down working. Swap in next month’s spreadsheet, or let a connected database refresh, and they see the new numbers.
Two ways to share
For clients, your team, partners and the board
Add anyone by email. They don’t need a seat in your workspace — just a free account under the address you shared with. Two ways to hand it over:
For the team chat, the intranet, the screen on the wall
Switch it on and the dashboard gets a link anyone who has it can open — no email, no code, no login. Paste it in Teams or Slack, pin it to the intranet, or leave it running on the office screen.
Links to a bookmark
Filter a page to one region, one client or one month, save it as a bookmark, and copy the bookmark’s link. Whoever opens it lands on that view, filters and all, instead of the report’s first page. Every link in the Share dialog can open at a bookmark too: the public link, the link for members and tracked links.
Inside the team
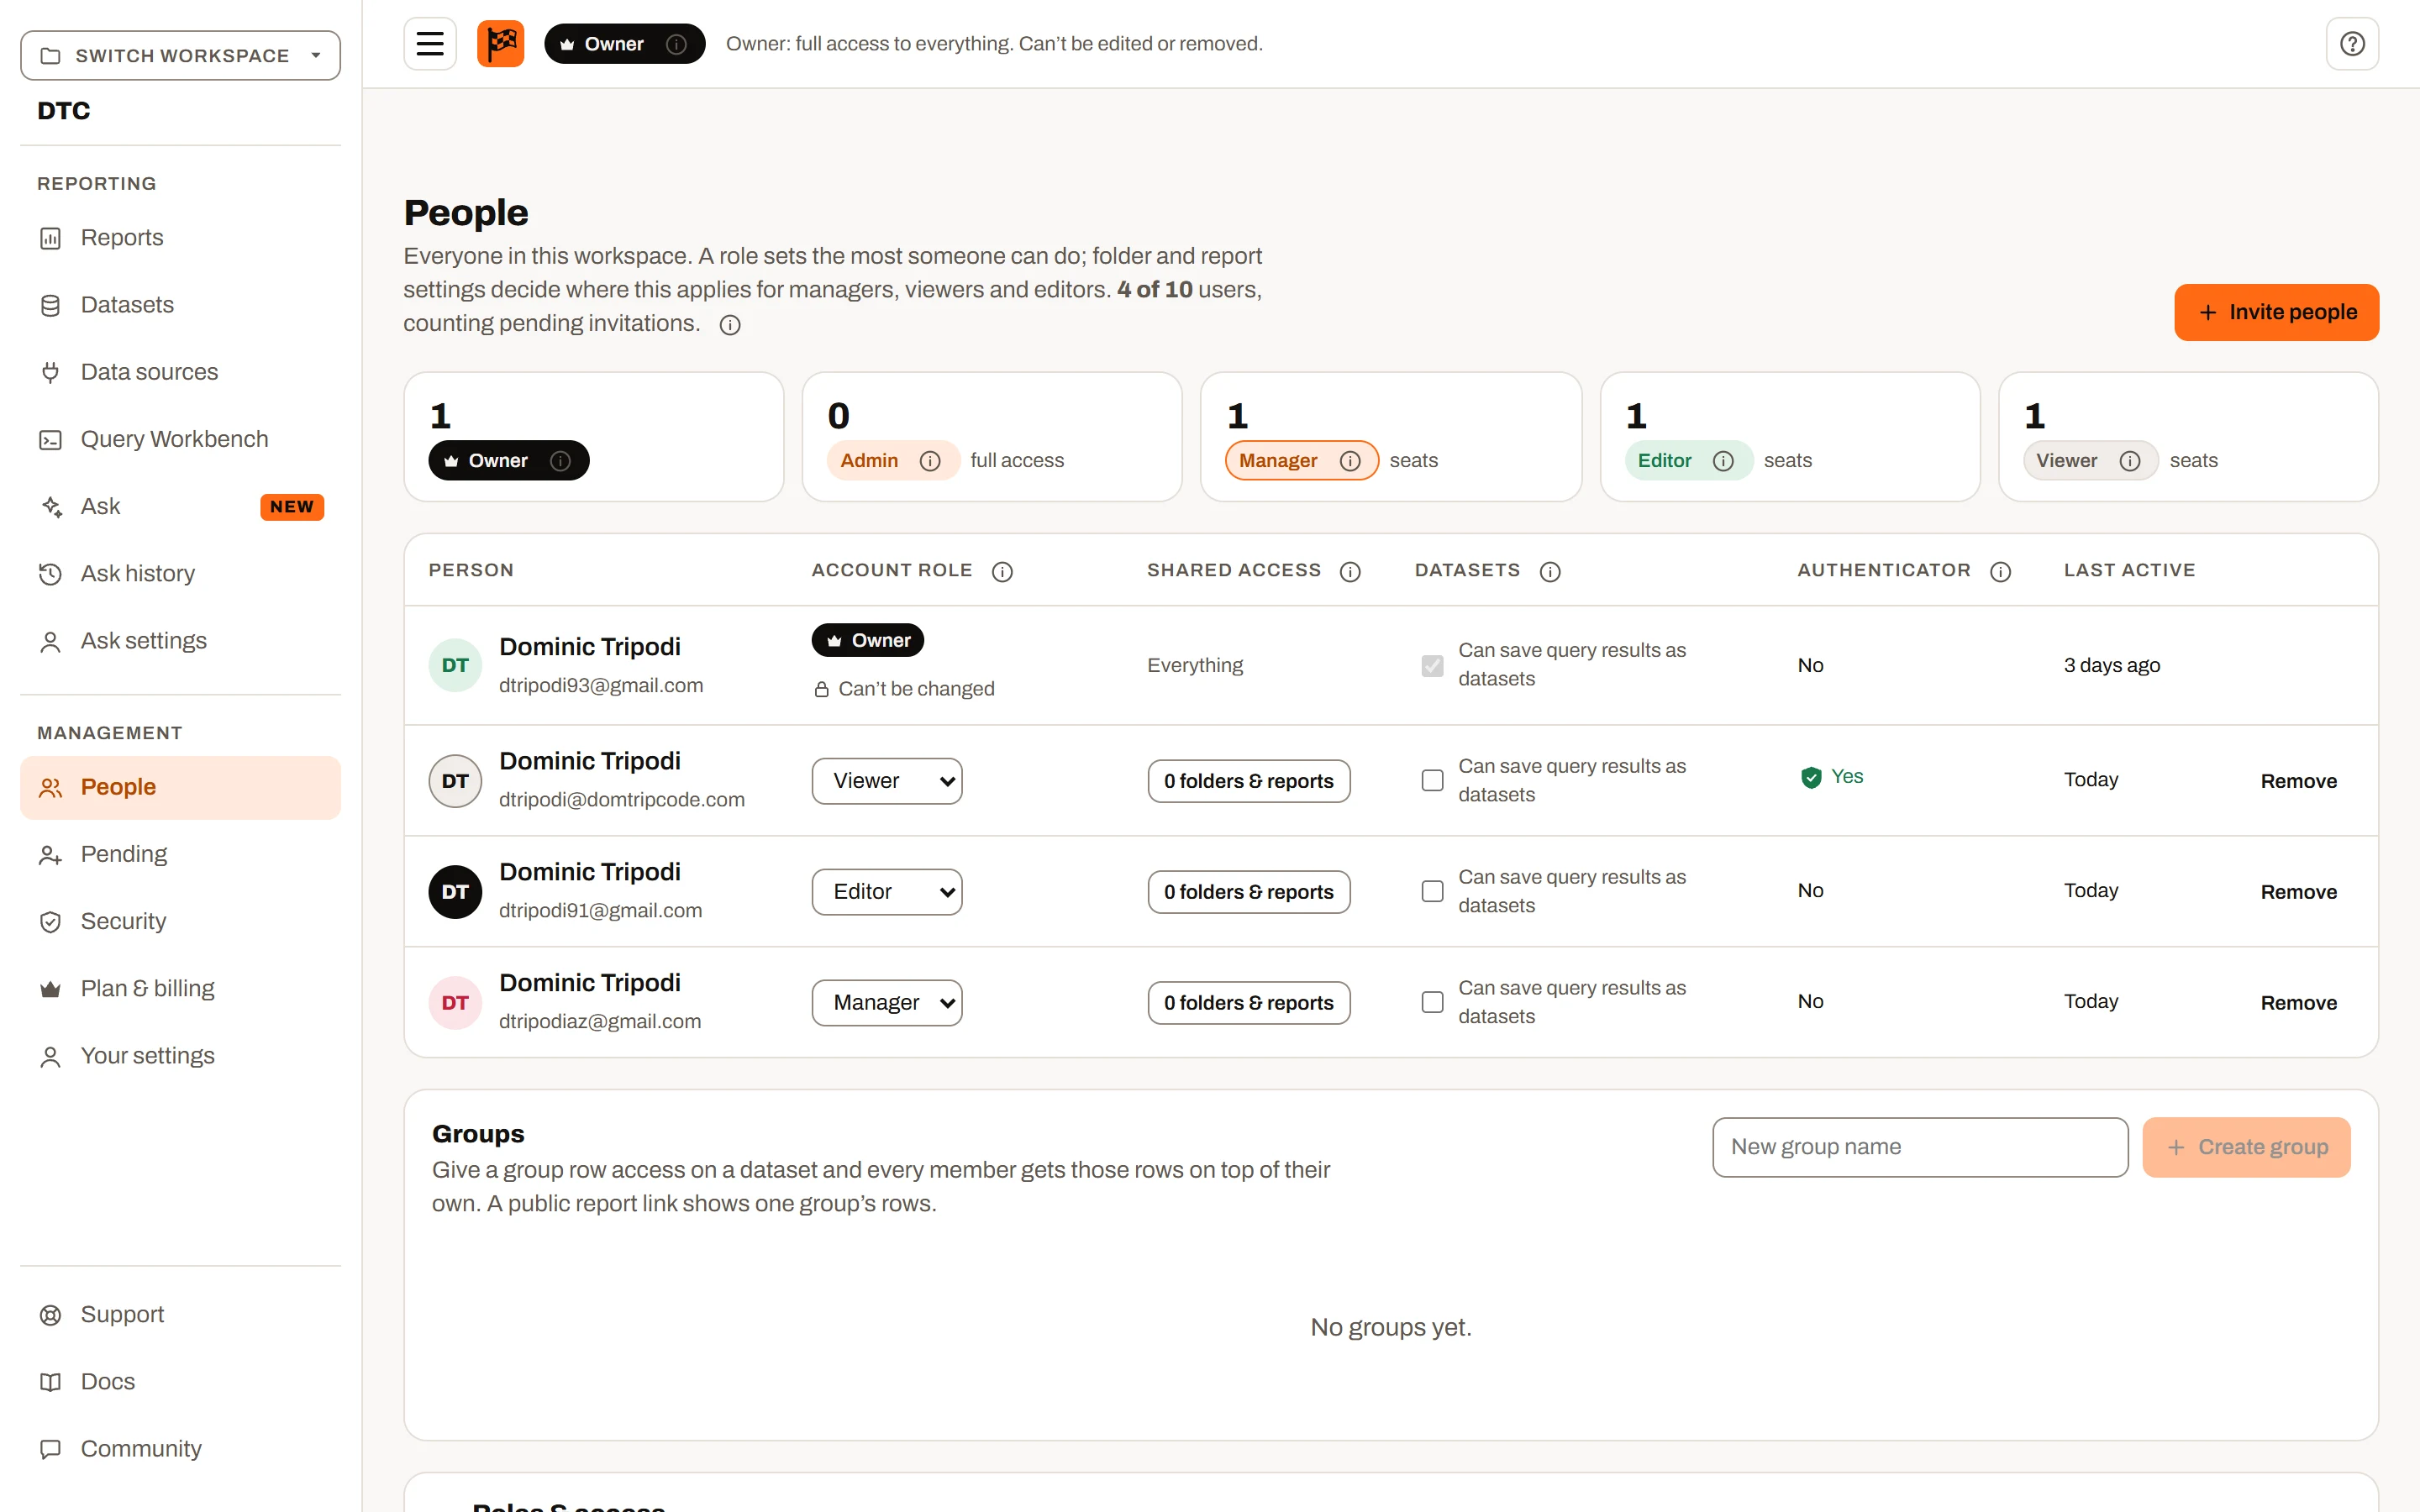
Each person has one role, which sets the most they can do. Share folders and reports to say where they can do it; a report inherits its folder’s access. Group people to give a whole team the same access and the same rows. Everyone keeps their own Favorites, and a workspace’s owner can hand it on to someone else. On Plus and Ultimate.
Row access Plus & Ultimate
Give each person or group the rows they should see — a region, a client, a department — and every report on that dataset shows them only those rows. You build the report once, not once per audience.
Who you can share with
Build the dashboard from their spreadsheet or your database and send it instead of a monthly PDF. It’s current every time they open it.
Invite · email link
Drop a link in the team chat and everyone reads the same numbers. No seats to buy, no logins to hand out.
Link or invite
Share fill rates or a scorecard with a supplier, and set access to end when the contract does.
Invite · sign-in required
An always-current link for the board pack, instead of a deck that was out of date by the time it was sent.
Invite · email link
Simple for them, in your hands
Whoever opens it sees the dashboard, its filters and its drill-down — read-only, with nothing to set up on their end. Behind it, you decide:
Set an end date per invite, or revoke it on the spot.
See who viewed the dashboard, and when.
A public link shows the rows of the person or group you choose, with “Visitors see rows as”.
Switch a link off, or swap it for a new one, in one click.
Show a report inside your own site or app, only on the sites you list.
Included with Ultimate
Ultimate is $99 a month, or $990 a year — two months free. Alongside sharing, it saves up to 50 datasets with your edits, keeps an unlimited number of reports, and sends printable reports and dashboards by email on a schedule.
On Plus, share folders and reports with the people and groups in your workspace, with row access. On Mini you can still export the grid’s data to Excel and send the file, and every plan can print a report or save it as a PDF. Ultimate is where the dashboard gets shared outside the workspace — live, view-only, and switched off whenever you say.
Inside the workspace, Plus: give people and groups access to folders and reports, with row access. Sharing a live dashboard outside it — by email, by link or embedded in your own site — is part of Ultimate, from $99 a month. On Mini you can still send a copy: export the grid’s data to Excel, and every plan can print a report or save it as a PDF.
It depends how you share. A public link needs nothing at all: anyone with it can view. Sharing by email is tied to the person: they sign in to a free Insight FastPass account under the address you shared with, so a forwarded email gets nobody else in, and the report sits under Shared with you on their own Reports page. Only the person sharing needs Ultimate.
No, there is no charge per viewer. Ultimate includes 10 users in your workspace, counting you, and you can add room for 10 more for $50 a month. People who open a view-only link don’t count.
No. Shared dashboards are view-only: viewers can filter, sort, drill down and print, but the data, the edits and the mappings stay yours. Nothing they change is saved.
The new numbers. Swap the spreadsheet behind a saved dashboard and everyone you shared it with sees the update next time they open it — no need to share it again. A dataset refreshed from a database on a schedule works the same way.
Yes, with row access on Plus and Ultimate. Give each person or group the rows they should see, and every report on that dataset shows them only those rows — on Ultimate, shared reports and public links included.
Yes: everyone with a role in the workspace counts toward its user limit, Viewers included. People you share a report with by email are guests, not members, and visitors on a public link aren’t counted at all.
Yes, on Ultimate. Pick the people, the day and the values each one gets, and it arrives as an attachment or a link, with a history of every delivery. A printable report goes as a PDF or Excel file; a dashboard as a PDF of one of its saved print set-ups, with only the rows each person may see.
Yes. Each workspace is its own plan, its own people and its own data, and you switch between them from the top of the page. Ownership of a workspace can be handed to someone else.
Yes, on Ultimate, in three ways. Embed a public report anywhere with one snippet. Embed a private one, and the people you shared it with sign in to see it, each with only their own access. Or register your app, and its server asks for a short-lived view of chosen reports as a chosen user, from the sites you list. Every embed is view-only, and you can switch it off at any time.
Switch it off, or swap it for a new link, in one click. For anything sensitive, invite people by email instead, so every view is tied to an address.
Sharing by email and public link is included with Ultimate, from $99 a month. Folder and report access, groups and row access start on Plus. Get started for free and upgrade when you’re ready to share.