BetaFree accounts and the desktop app are available now. Paid plans, with reports on the web, sharing and live connections, launch once enough people ask for them. Express your interest »
How it works
Upload, check, explore: three steps from the data to the answer.
Insight FastPass reads the file you already have, or the database behind it, and turns its columns into a dashboard you can act on, in minutes. How you use it depends on whether it’s a one-off look at a workbook, a report you come back to every month, or one that keeps itself current.
Someone sent you a workbook and you need to understand it before the meeting. Upload it, explore it, build the dashboard — and close the tab when you’re done.
1
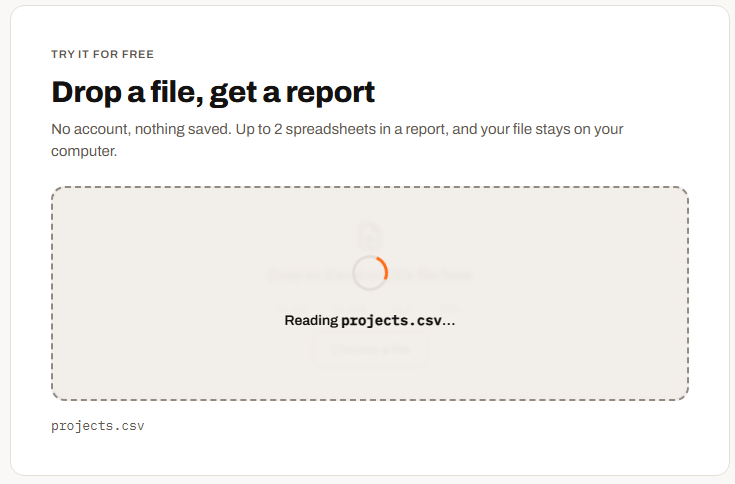
Upload. Drop in a CSV or Excel file. Nothing to install, no account.
2
Check. Every column is read and typed in your browser; the file stays on your computer.
3
Explore. The first page builds itself. Add charts, KPI tiles and grids, and read the answer off it.
Kept: For the current session.
Mini, Plus & Ultimate
Available now in the desktop app Saving reports on the web comes with the paid plans. The desktop app keeps them in its library during the beta.
The report you rebuild every month
The same workbook comes round every month-end, and someone rebuilds the same pivot. Build the report once and save it; from then on, the new spreadsheet is all it needs.
1
Build once. Start from a page template or a blank page, and set the formatting.
2
Save. The dashboard, its mappings and its formatting are kept in your account.
3
Swap the file. Next month, drop in the new spreadsheet with the same column headers. The report rebuilds on the new rows.
Kept: Up to 10 reports on Mini, 20 on Plus and an unlimited number on Ultimate. Plus saves up to 10 datasets, with your edits saved; Ultimate up to 50.
Plus & Ultimate · Data sources
Available now in the desktop app Connections from the website come with the Data sources add-on. The desktop app connects to your own databases and refreshes on a schedule during the beta.
The report that keeps itself current
The numbers live in a database, and the report should keep up with them without anyone exporting a file. Connect once, pick a schedule, and the dataset refreshes on its own.
1
Connect. SQL Server, PostgreSQL, MySQL or Oracle — directly, from the cloud without a stored password, or through a gateway in your network.
2
Choose. Replace the rows on each refresh, or add a dated snapshot to trend over time.
3
Schedule. Every 15 minutes to once a week. Every report on the dataset follows.
Logged: Every run and what it loaded. A failed run says why, in plain words. Reports read the stored copy, so opening one never touches your database unless you make a dataset live.
Coming soon: Adding a SQL Server data source, testing it, making a dataset and setting a 15-minute refresh
Page templates
Start from a page that already fits your columns.
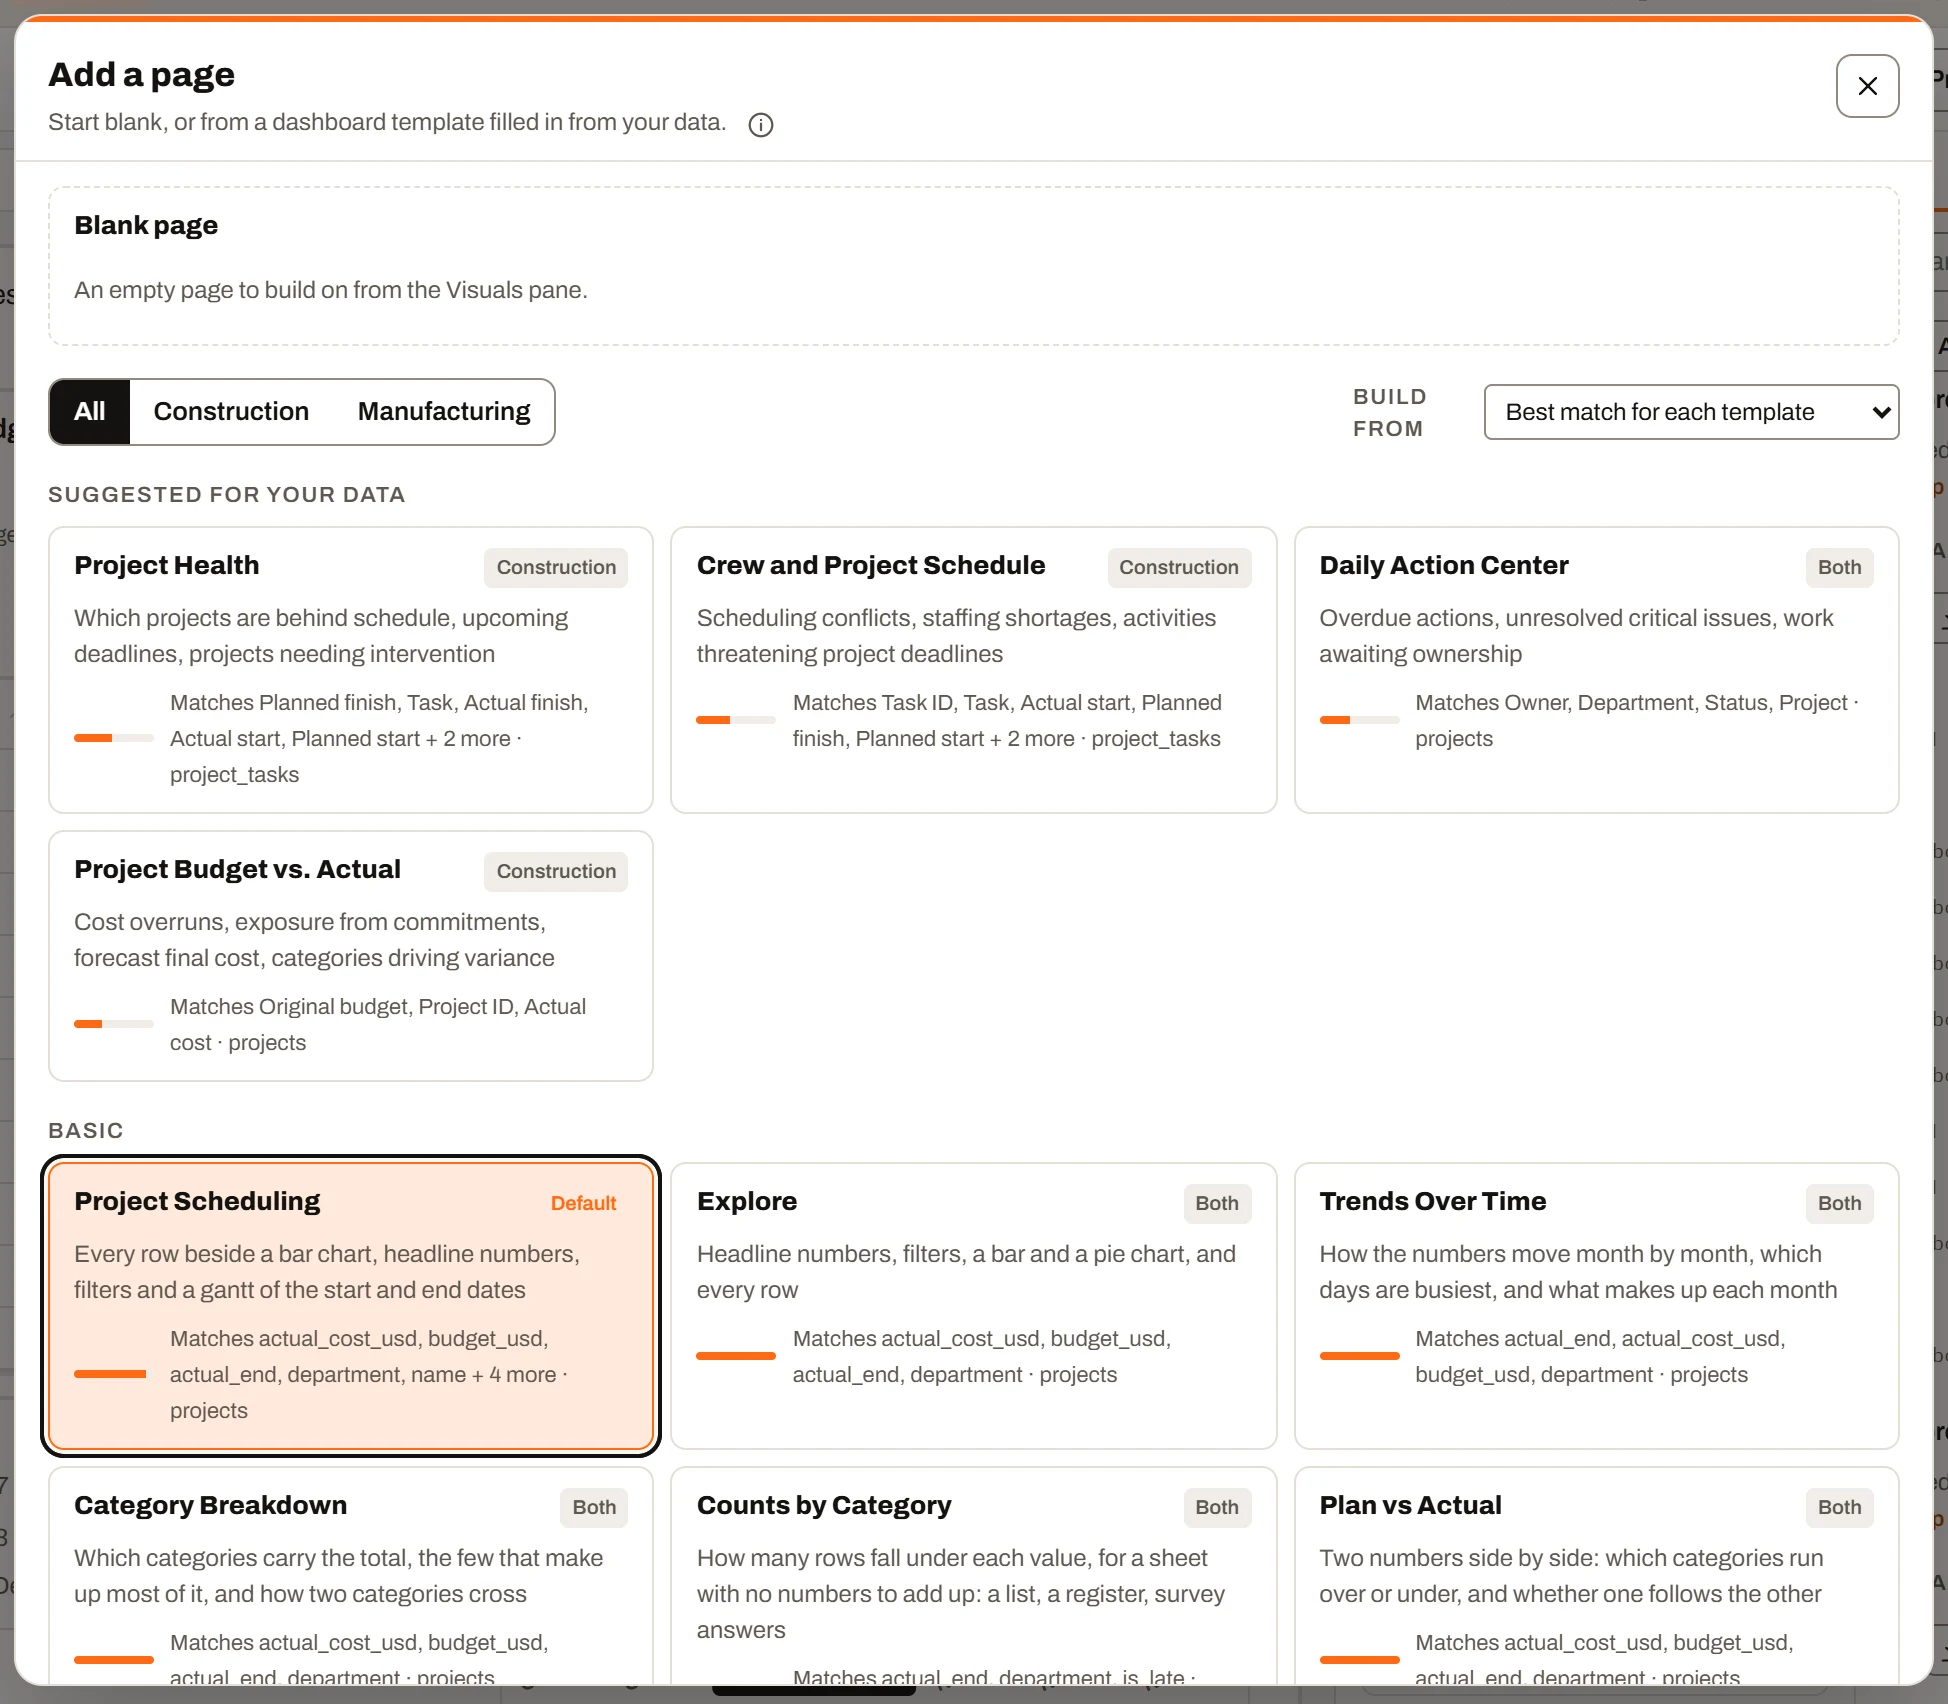
“Suggested for your data” ranks the dashboard templates by how well they match your columns, with a fit meter on each. Filter by industry, choose which dataset to build from, and check the fields before the page is made. Free has 5 basic templates, Mini has all 9, and Plus and Ultimate have 40.
Demo — templates that already fit your columns
Under the hood
Data in, insight out, and a way back.
Your data
A file or a database
An export · a workbook · SQL Server, PostgreSQL, MySQL or Oracle
→
Columns
Read and typed
Dates, numbers and currency detected · formats kept with the dataset
A template that fits, or a blank page · 10 core visuals on Free, all 33 visual types from Mini · a printable report for invoices and lists
→←
Report
Your dashboard
Filters · drill-down and drill-through · print · PDF and Excel · share · export
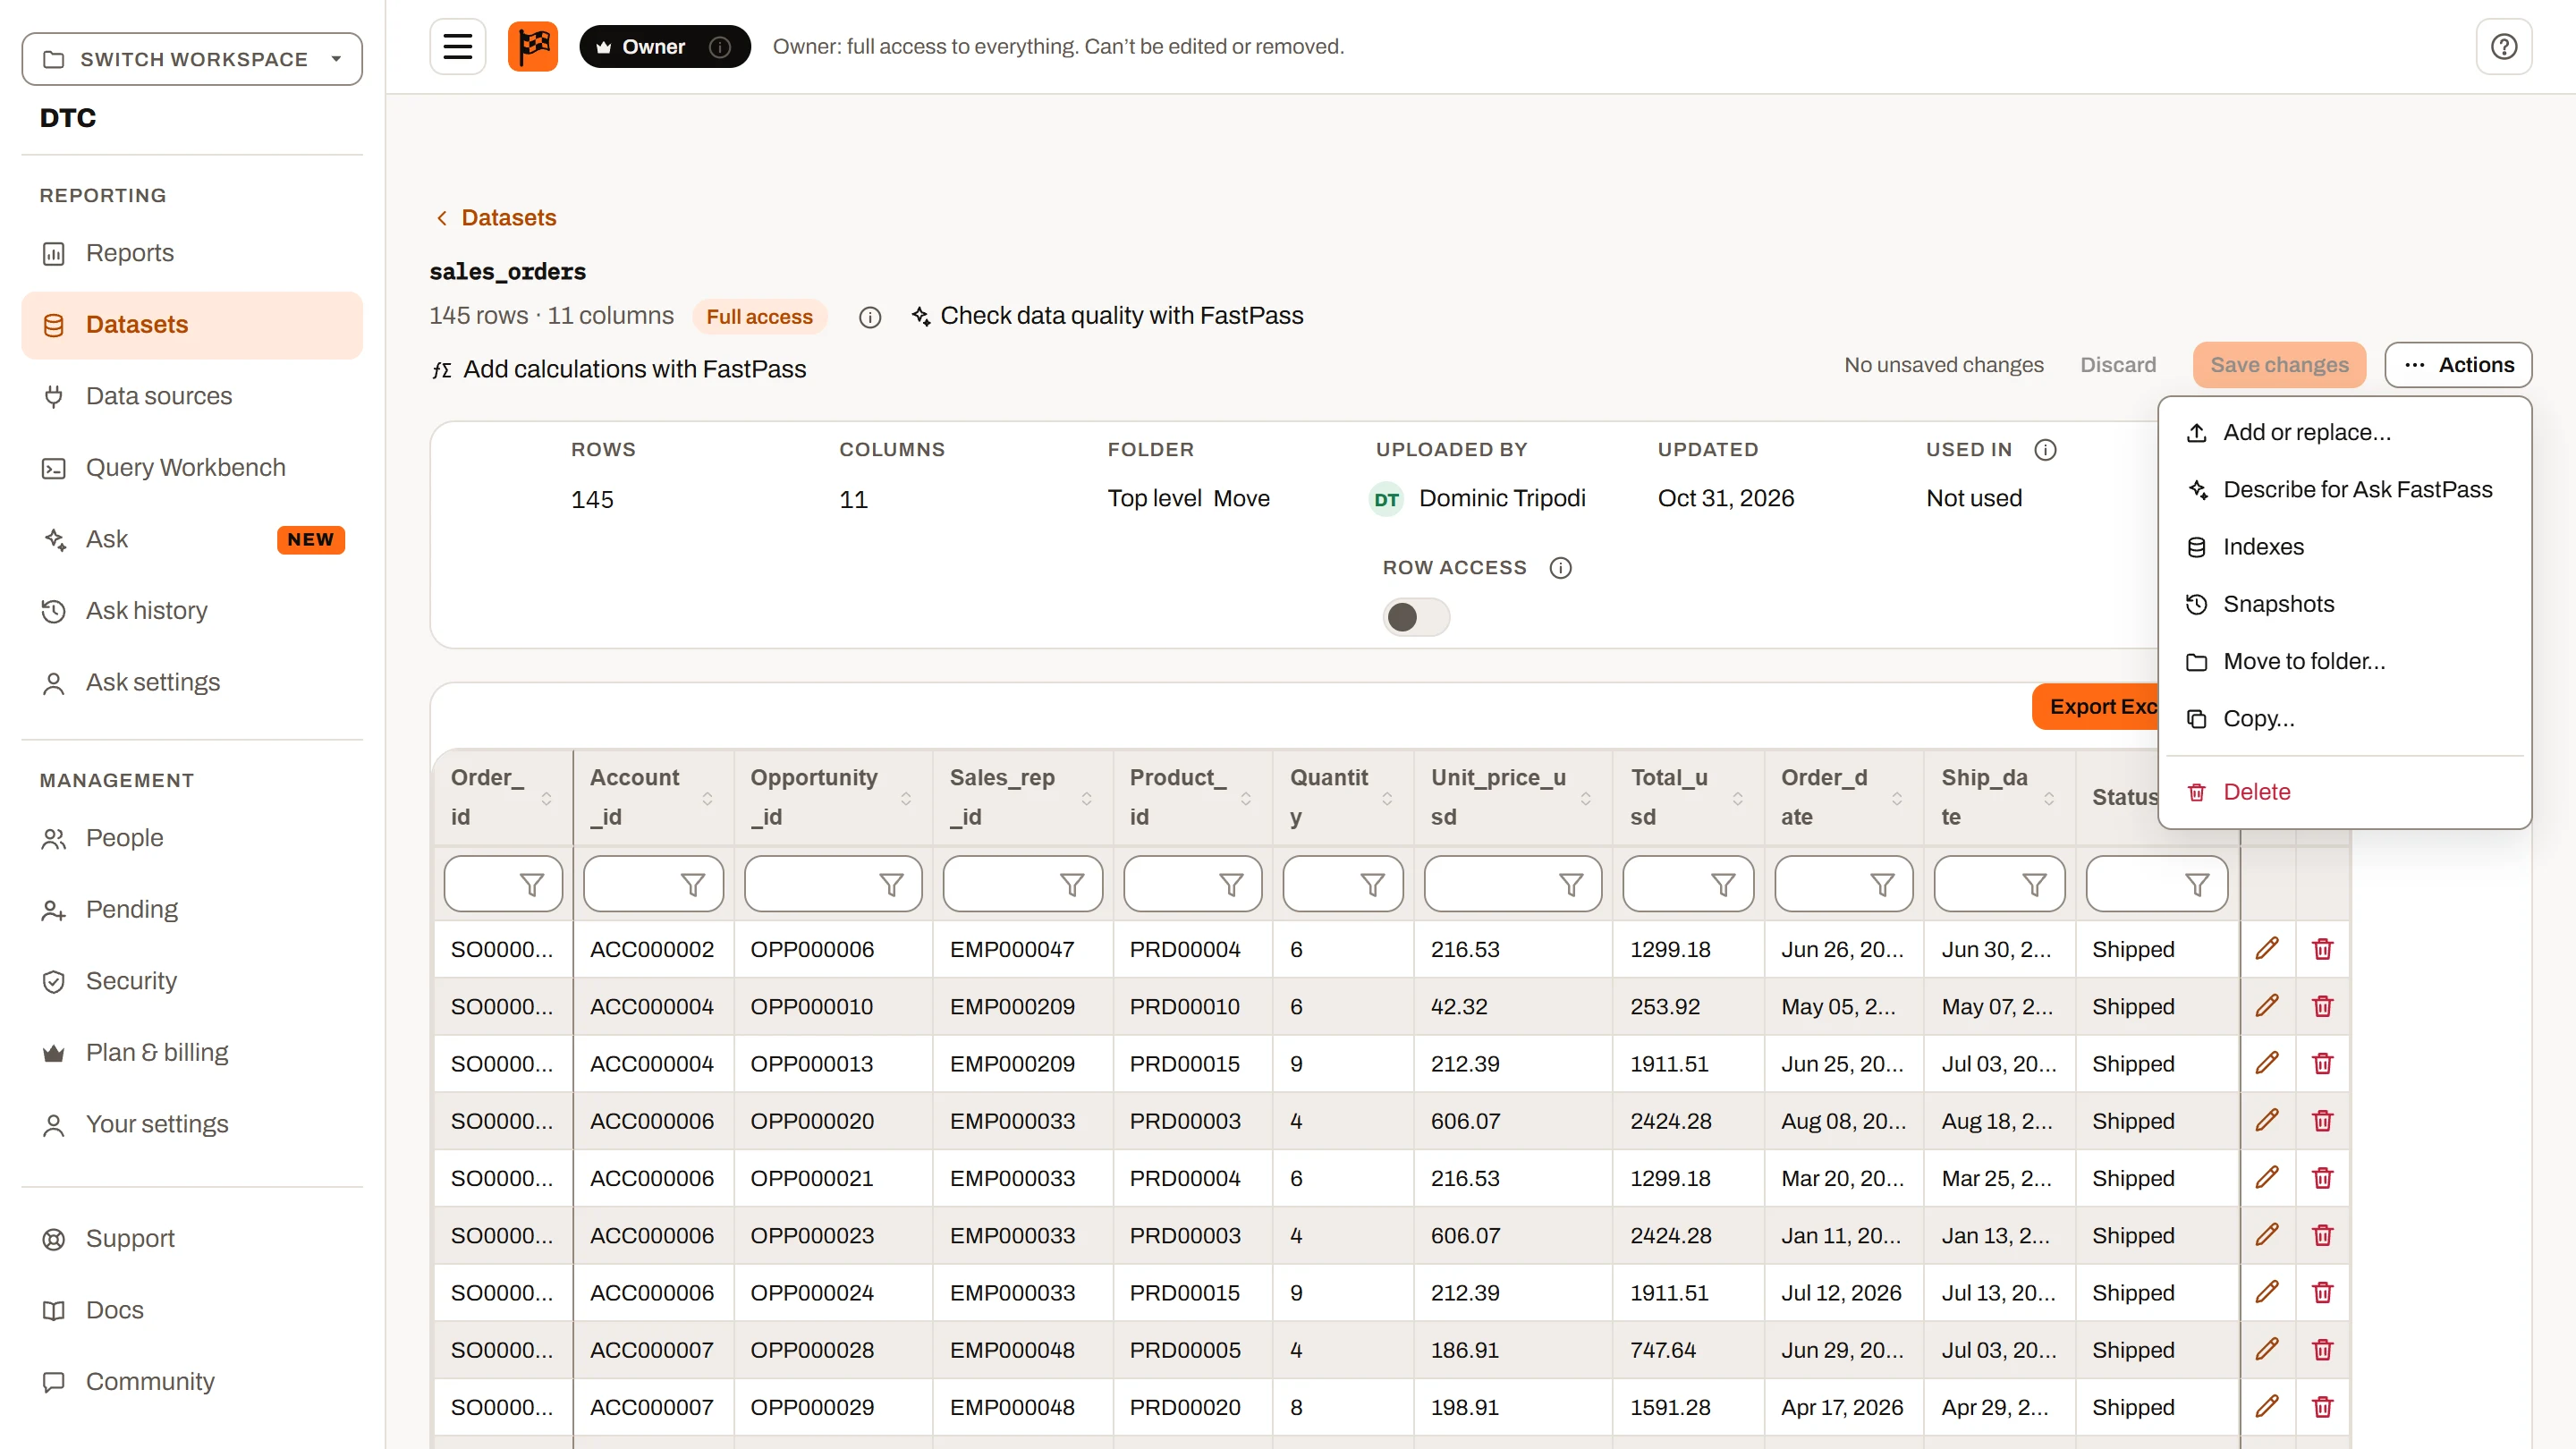
Orange arrow: write-back. Edit rows in the report grid and export the data again as a spreadsheet — on Plus and Ultimate, the edits are saved with the dataset, and with the Data sources add-on they can be written back to your own database.
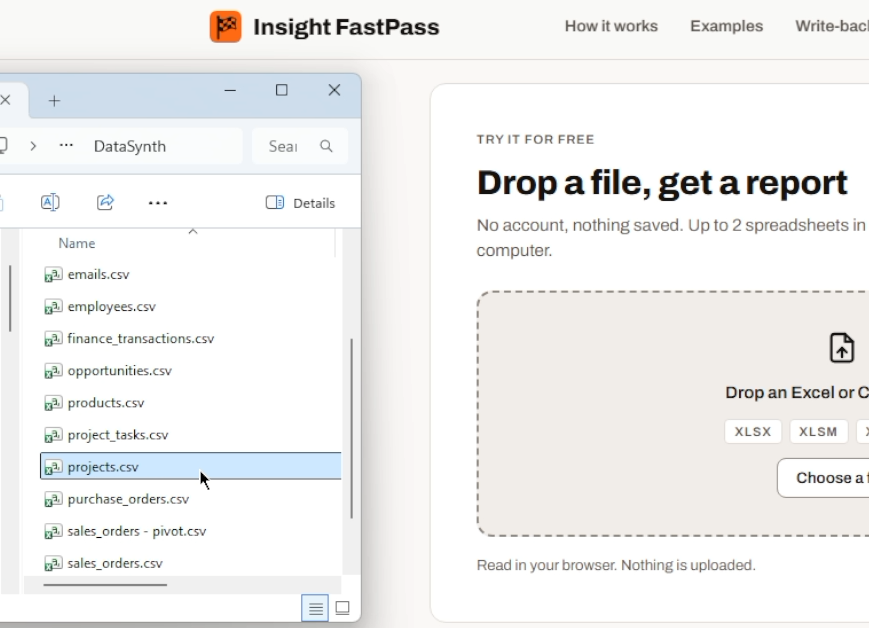
Open the free try-it page and drop in a CSV or spreadsheet. Pick the tabs to bring in if the workbook has more than one. Data in a database? Connect it in the free desktop app instead.
Minute 2
Check the columns
The file is read in your browser, and every column gets a type. Fix any that came out wrong before anything is built.
Minute 5
Read the answer
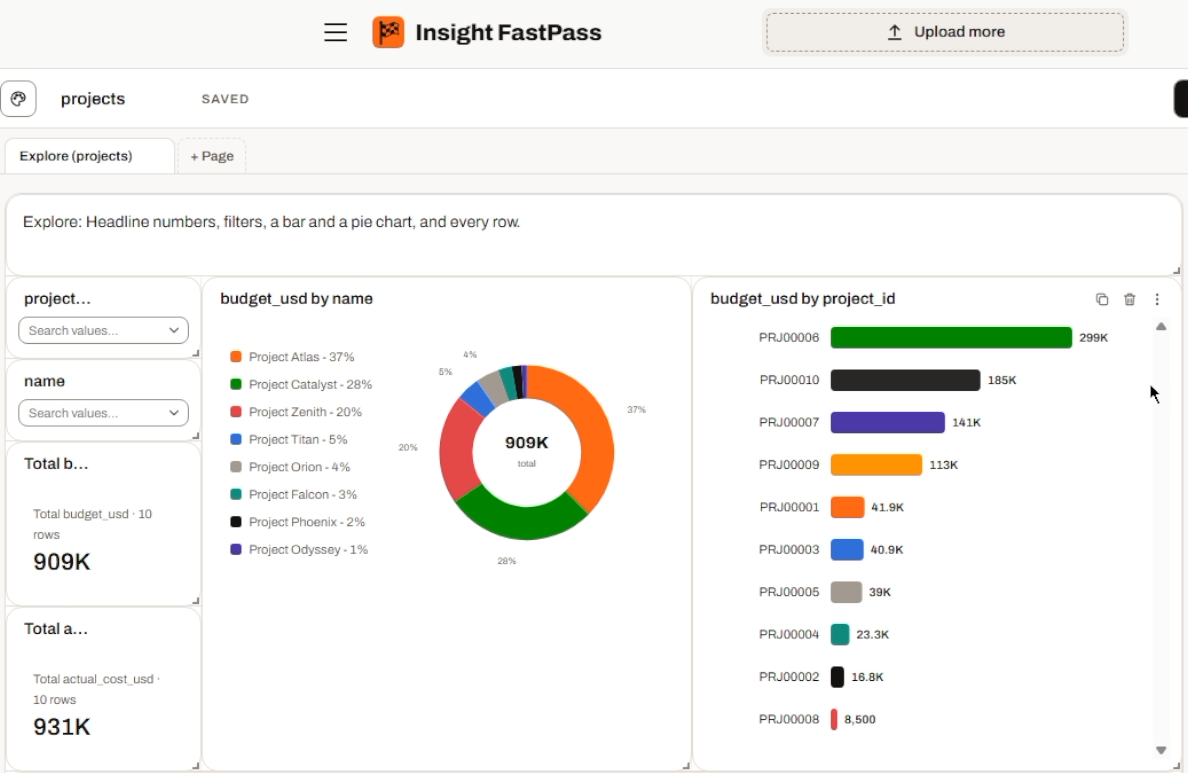
The first page builds itself: totals, charts, filters and every row. Add pages from templates; filters and drill-down work across the whole report without a formula.
Day 2
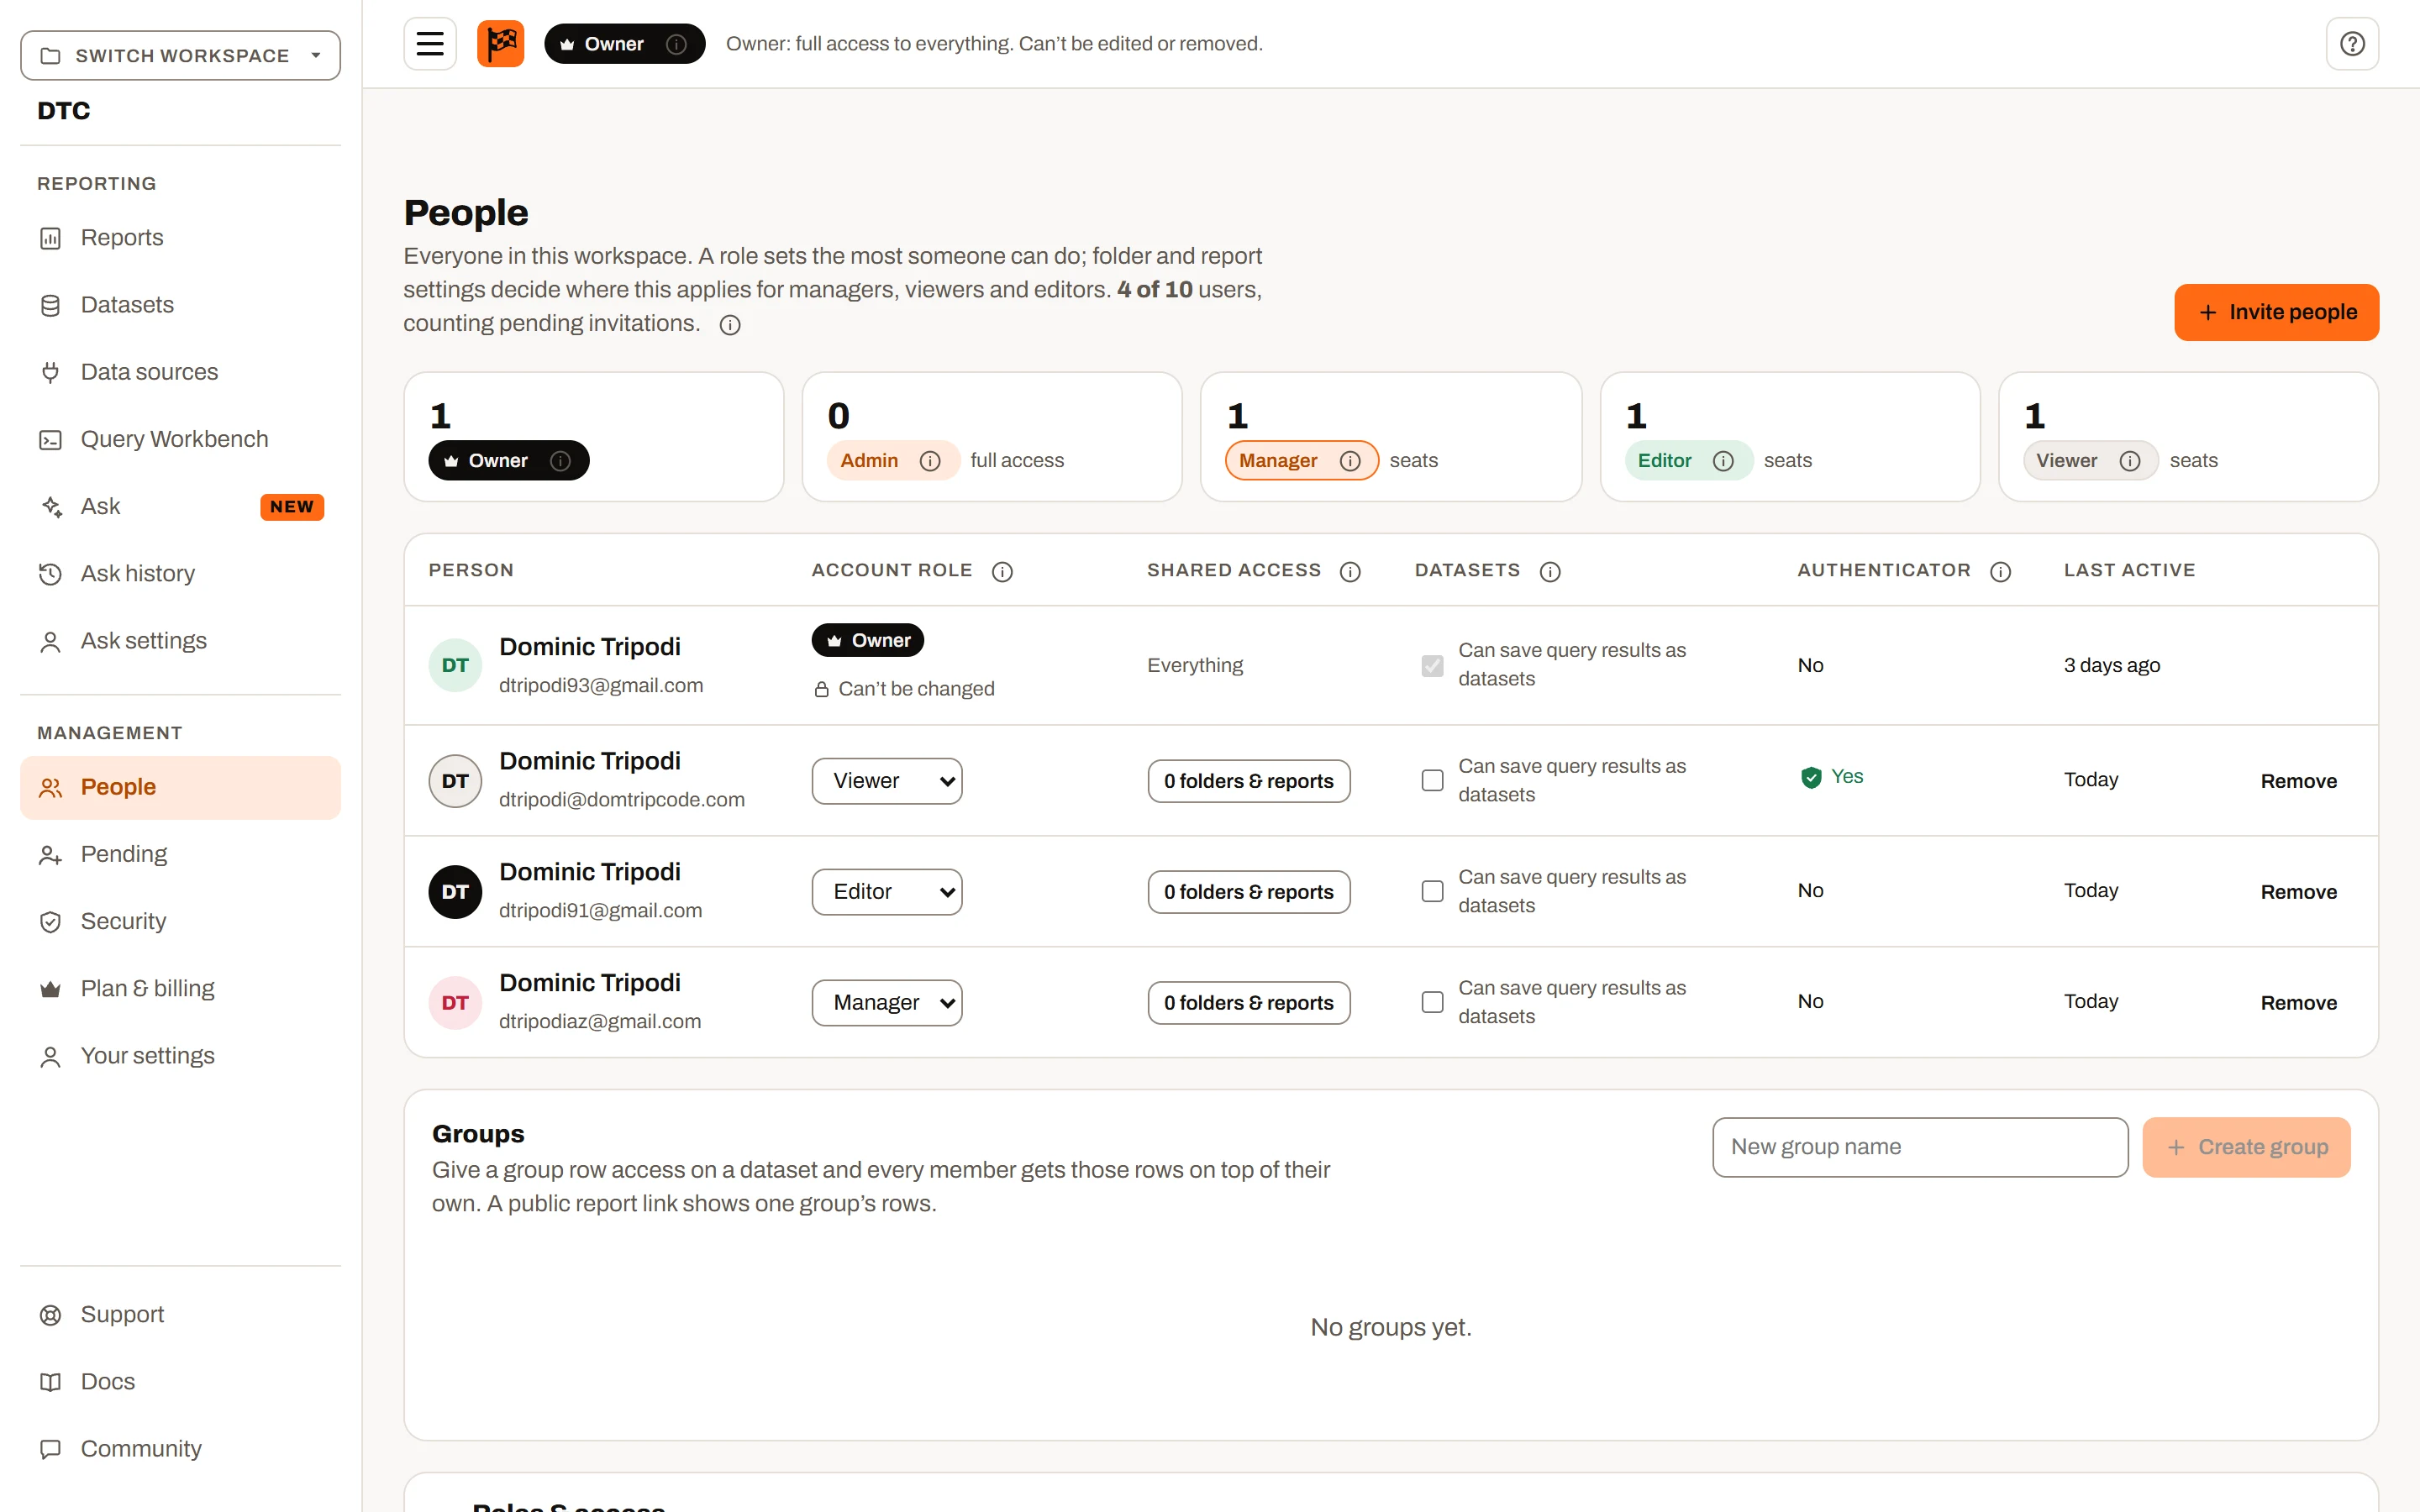
Invite the team
Add people to the workspace, and on Plus and Ultimate give each one, or each group, access to just the folders and reports they need. Guided tours walk each of them through the screens their role uses.
Next month
Drop in the new file
On Mini, Plus and Ultimate the report is saved. Upload next month’s spreadsheet and it rebuilds on the new rows — or connect the database and skip the file altogether.
Minutes are a guide, not a promise: a tidy export with one header row is quicker than a workbook with merged cells and three tables on one tab.
Help when you want it
Learn it on the real screens, not in a course.
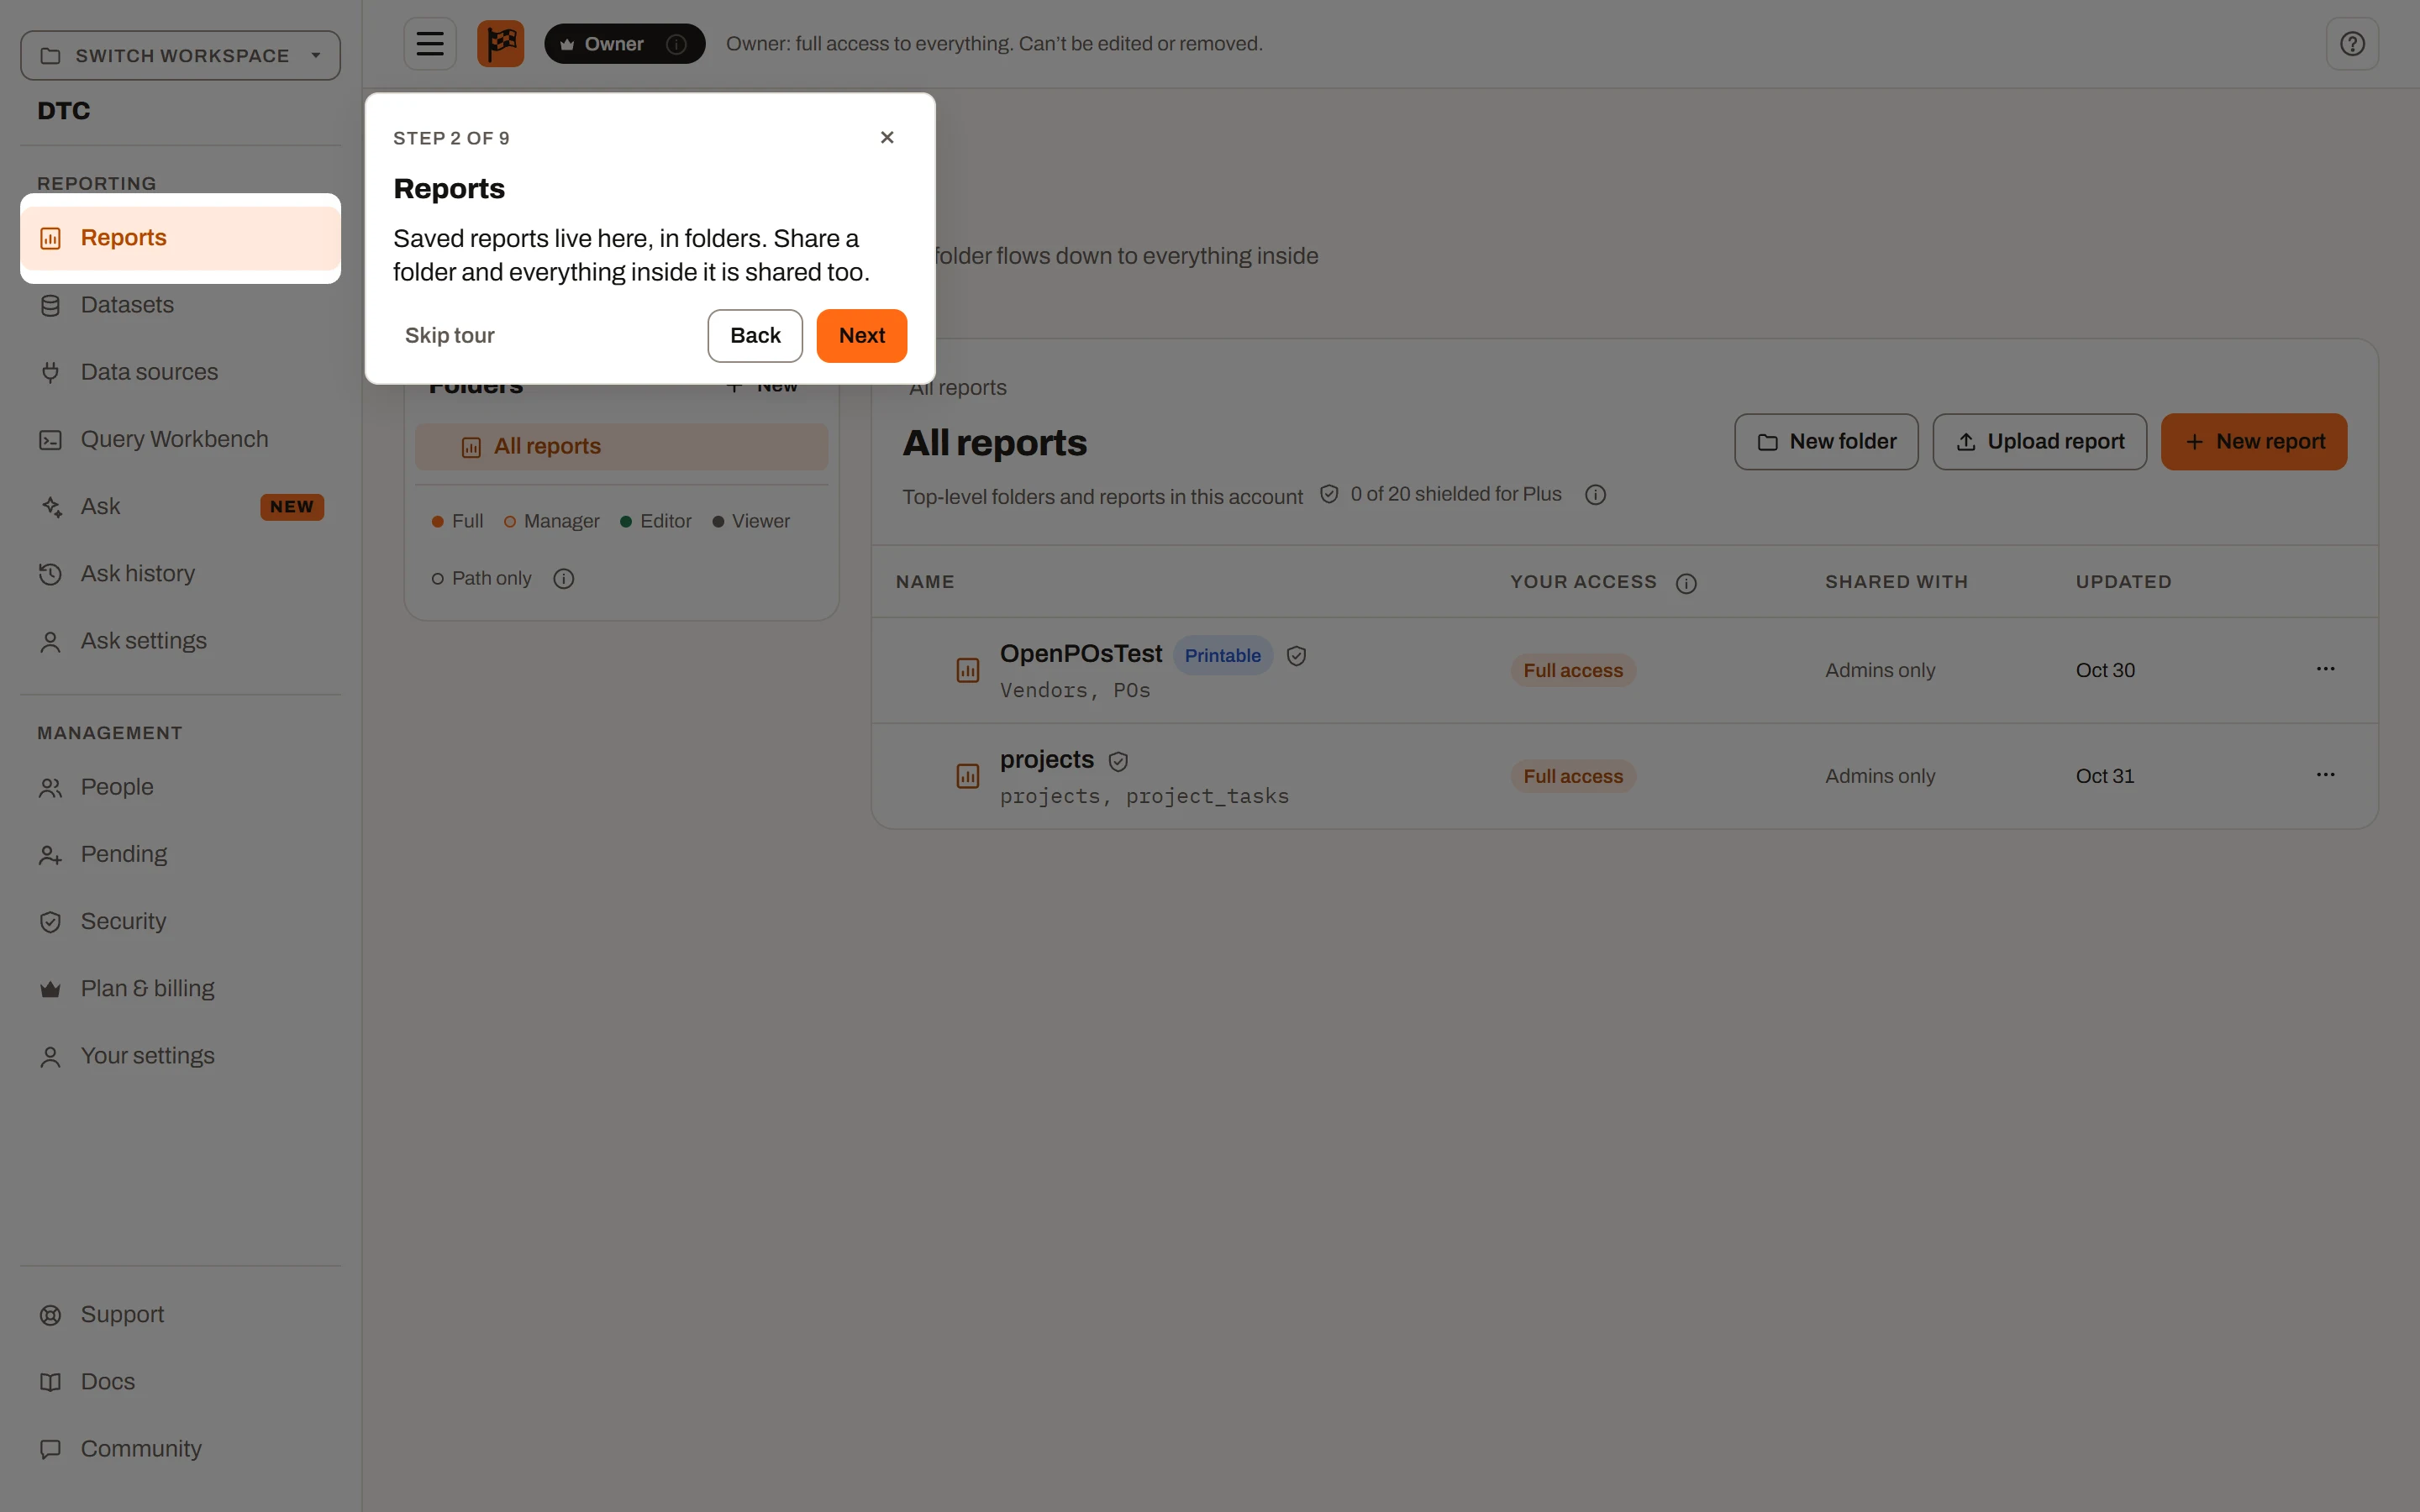
Short guided tours run over the screens you are using, matched to your role and plan. When you want more, every part of the product has a guide, and support is a request away.
Guided tours
A spotlight on one control at a time, with a sentence on what it does. Pause, resume or skip, and see what’s new after an upgrade.
Docs
A guide for every part of the product, from the first upload to row access and formulas.