
Docs › Build reports
Filters and interactions
Filters narrow what a report's visuals show. You can filter every page, one page or one visual from the Filters tab, filter a page with a Filter visual, limit one visual with its own conditions, and click a bar, slice or row to filter the rest of the page on the spot. This guide explains each, how they combine, and how they sit on top of row access.
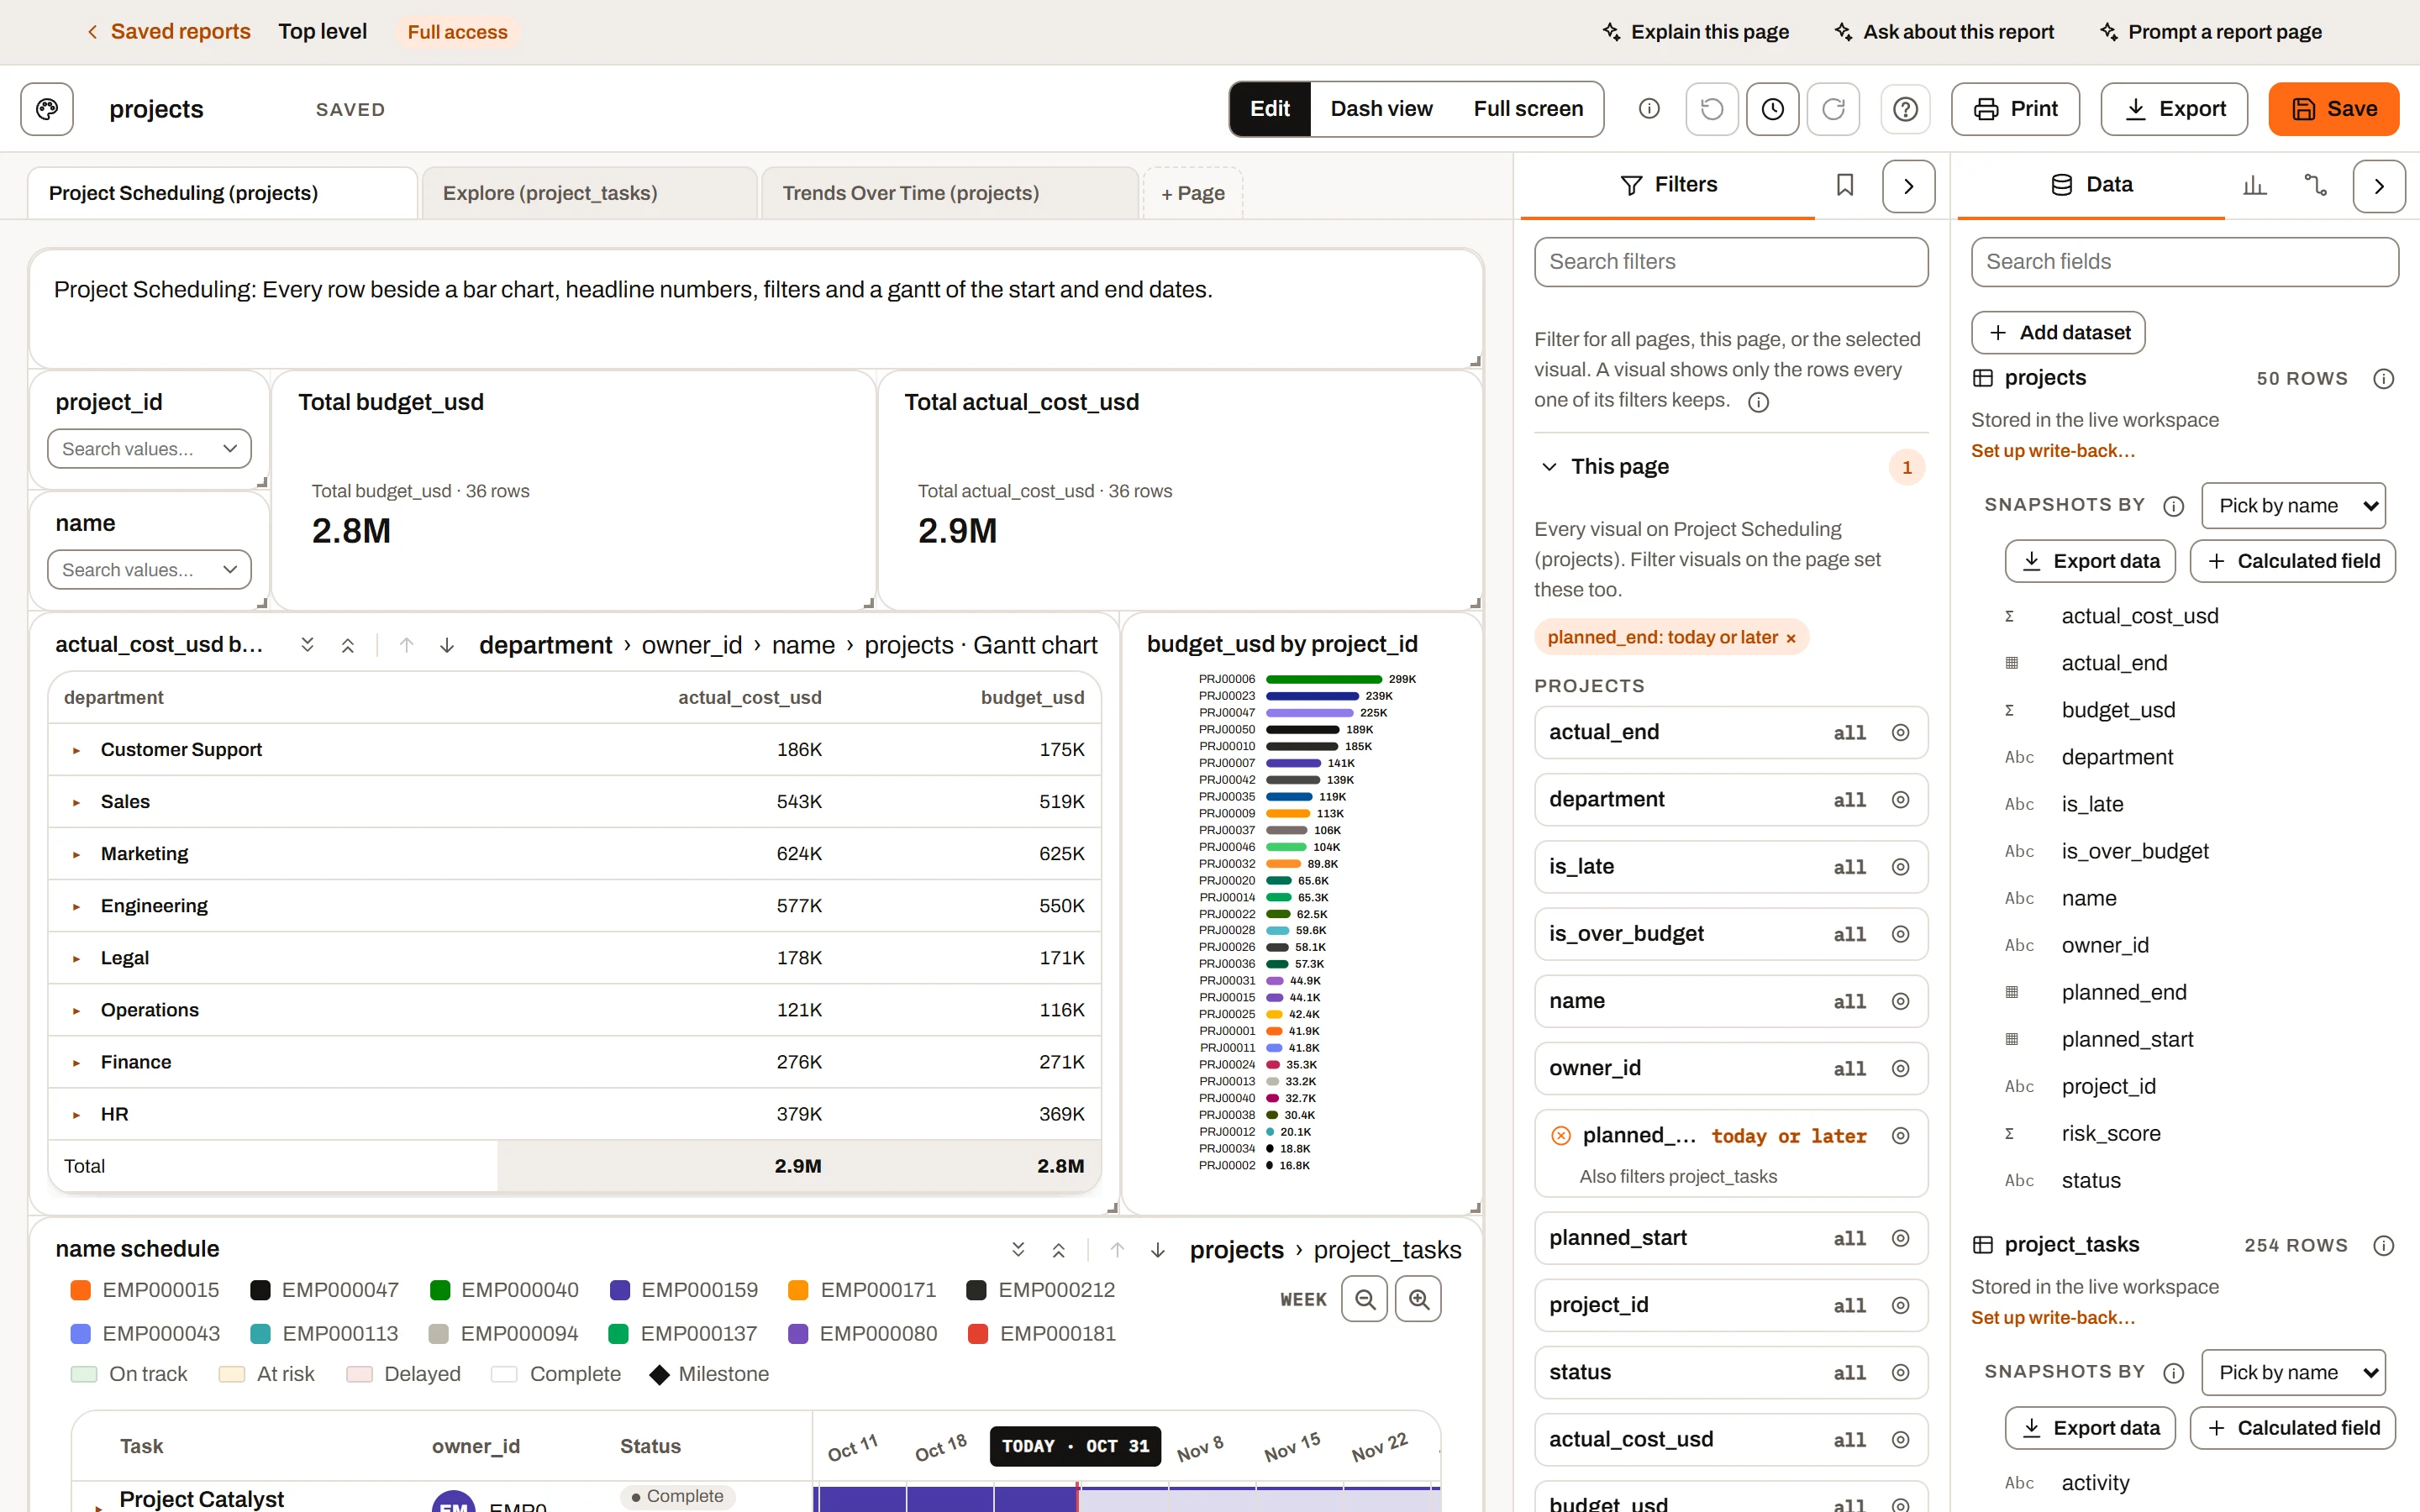
The projects report open in the builder.
The ways to narrow data#
| Way | Set where | Applies to | Saved with the report |
|---|---|---|---|
| Report filters (All pages) | Filters tab | Every visual on every page that reads the same dataset, or a dataset connected below it | Yes |
| Page filters | Filters tab, or a Filter visual | Every visual on the page that reads the same dataset, or a dataset connected below it | Yes |
| Visual filters (This visual) | Filters tab, with the visual selected | That visual only | Yes |
| Visual conditions ("Show only rows where") | The Visual pane of one visual | That visual only | Yes |
| Click-selection (cross-filtering) | Clicking a mark in a visual | Other visuals on the page, including connected datasets | No |
| Drill-through | Right-clicking a mark, Drill to page | The drill-through filters of the page it opens | As page filters, until cleared or the next drill |
| Row access | The Datasets page, by an admin | Everything you see, everywhere | Set on the dataset |
They stack: a visual shows the rows you're allowed to see, that pass the report's, the page's and its own filters, then the current click-selection, then its own conditions.
Filter scopes#
The Filters tab of the Visual pane has a section per scope. Each works the same way; they differ in what they reach:
- All pages (report filters): every visual on every page, including pages added later.
- This page (page filters): every visual on the open page. Filter visuals on the page set these.
- This visual (visual filters): only the selected visual. The section shows only while one visual is selected, and lists that visual's own dataset's columns.
The same column filtered at two scopes has to pass both: "Region: North" for all pages and "Region: South" on a visual leaves that visual empty. A visual filter is copied with the visual when you duplicate or paste it, and saved in a bookmark with its page.
Page filters#
Page filters belong to one page and apply to every visual on that page that reads the same dataset. Filters for all pages and for one visual work the same way (see Filter scopes).
Filters reach connected datasets#
A filter also narrows every dataset connected below its own, the way a click-selection does: from the side of a connection where each value appears once (Customers) to the side where it repeats (Orders), and on down from there. Filter Region on Customers to West, and an Orders chart shows only West customers' orders; Returns, connected under Customers too, narrows the same way. It never goes back up (a filter on Orders leaves a Customers chart alone) and stops at a many-to-many connection. An order with no matching customer is left out while the filter is on.
While a block in the Filters tab filters anything, a line under it says where else it reaches ("Also filters Orders, Returns"); point at it for the path each takes ("Customers → Orders"). Connections are set up in the Connections tab (see The Connections pane).
The Filters tab#
Open Filters at the top of the Visual pane (Edit mode); it is open whenever no visual is selected. It reads "Filter for all pages, this page, or the selected visual. A visual shows only the rows every one of its filters keeps." Each scope is a section you can fold: This visual (with a visual selected), This page and All pages, each with how many filters it holds.
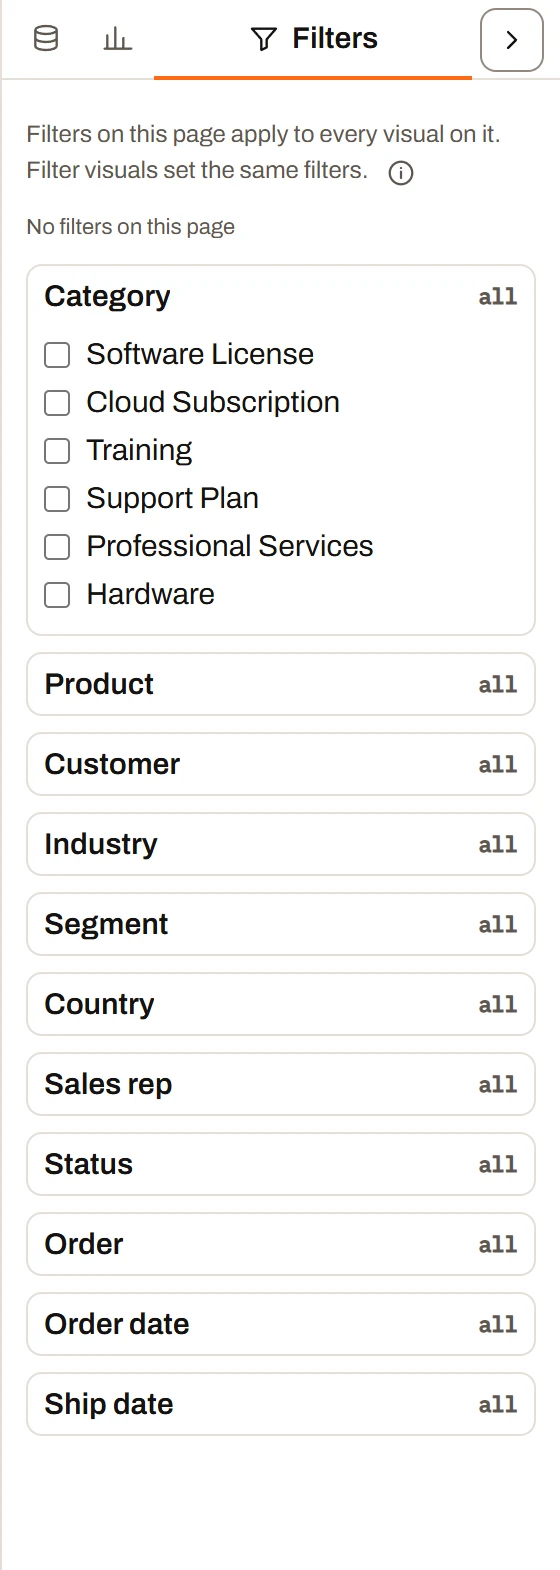
The Filters pane.
A Search filters box sits at the top of the tab and stays there while the sections scroll under it. Typing keeps only the column blocks whose name (or dataset's name) holds the text, in every section, and the parameter cards whose label or name holds it. Sections with a match unfold; sections without one fold. Clearing the box brings everything back.
In each section:
- Chips for every active filter: one per picked value ("Region: West", "(blank)" for an empty value) and one for a filter's conditions ("Budget: ≥ 100 and ≤ 500"). × removes it. Clear all appears with two or more. With none: "No filters here".
- A block per column of every dataset, text and date columns first, then number columns (grouped under dataset names when there are several; on This visual, only the visual's dataset). Each shows the column's name and "all", "n of m" or its conditions ("≥ 100 and ≤ 500").
- While it filters anything, a circled × before the column's name clears it.
- Opened, it has two buttons at the top: List and Conditions. A number column, or a column that already has conditions, opens on Conditions; the rest open on List.
- List shows every value as a checkbox ("(blank)" for empty; dates without their time; months as "Dec-25"). Tick to keep only those rows; untick to remove. Clear resets the block.
- Values come from every row of the dataset, not narrowed by other filters.
- Past 200 values, a search box ("Search n values") appears; the list shows matches, ticked ones first, up to 200, with "n more. Type to narrow the list."
- Conditions shows condition rows: the same editor as Show only rows where, with the field fixed. Each row is a comparison and a value. Numbers offer is more than, is at least, is less than, is at most, is between and more. Dates offer is after, is on or after, is before, is between, is in the last / is in the next n days, is before today and more. Text offers contains, is, is not and blank tests. + Add condition adds a row; with two or more, All (and) or Any (or).
- A column keeps either ticked values or conditions. Changing the conditions replaces any ticked values, and ticking a value replaces the conditions. Switching between List and Conditions alone changes nothing.
- Conditions work in every section, All pages included. A number column set to Category in the Data pane opens on List, like text.
- A filter with more than 8 values shows as one chip ("Customer: 1,204 values"), whose × clears it.
- On This page, each block has a target button that makes the column a drill-through filter (see Drill-through).
Every change is one undo step.
Filter visuals#
A Filter visual puts a filter on the page itself, where viewers can use it in Dash view too. Add it from the Visuals pane and give it a Field. Without one: "Pick a field in the Data pane". It sets the same page filter as the Filters tab's This page section, so the two always agree. A filter for all pages or for one visual on the same column still applies on top of it, and the Filter visual lists only the values those leave.
Settings in the Visual pane (see Visual options for the rest):
- Filter by (number and date fields):
Mode Field types How it works Pick values All Tick values to keep. Range slider Number, date Two handles over the field's lowest-to-highest values; the page is filtered when you let go. A handle left at the end sets no limit on that side. Whole numbers and days step by one. "Not enough values for a range." when there aren't two. Conditions (>, <, =…) Number, date Click the filter to add rows of a comparison and a value: the comparisons Show only rows where offers for the field's type (for a number: is more than, is at least, is less than, is at most, is, is not, is between; for a date also the relative ones such as is in the last n days); + Add condition; with two or more, All (and) or Any (or). Saved as you type. The box shows them ("≥ 100 or < 20"). Year and month Date A tree of years (tick a whole year; partly ticked shows a dash) and their months. A month keeps every date in it. Changing the mode clears the page's filter on that field.
- Display (Pick values): Drop-down (default; one box with picked values as removable chips beside it) or Buttons (a pill per value).
- Type to search (drop-down): on, typing narrows the list and Enter picks the first match; off, the box works like a plain select.
- Selection: Multiple (default) or Single. With Single, picking a value replaces the last; picking it again clears. Switching to Single keeps only the first picked value.
- Selected / Unselected colours (Unselected for buttons only); text turns black or white for contrast. Default resets.
- Clear appears on the visual whenever it filters something.
Behaviour to know:
- Its list shows the values left by every other filter on the page and the current click-selection, but not its own field's filter, so you can always pick another value.
- At most 200 values are drawn (picked ones first). Buttons show "n more values. Switch the filter to a drop-down with search to reach them."; a drop-down with search lets you type to reach the rest.
- A Filter visual never starts a click-selection, and follows one only if Filtered by other visuals is on.
- Changes are undoable and saved with the report; viewers' changes aren't saved.
What a Filter visual picks: its parameter#
Each Filter visual presents a report parameter, made for it when you give it a field. The Filters tab lists it under Parameters, with where it is shown ("Filter visual on Overview"). Open it to set:
- Label and Name. A link to the report can give it a value as
?Name=value(several values separated by commas); that value stands in for the default. - Available values: From a query (a dataset's field), the field's values (the default), or A list I type, one value per line as
valueorvalue = label. The Filter visual shows the labels. - Default: the values a page starts with picked, separated by commas. Dates can be relative (
today,startOfMonth,-30d) and a date range isfrom..to. With a default, Clear on the Filter visual picks all, and the page keeps that. - Required: until a value is picked, the visuals it reaches show no rows and the Filter visual says "Pick a value".
- Allow null value and Allow blank value: (Null) and (Blank) are always among the choices; they keep the rows with an empty cell, or with blank text.
A parameter only narrows the rows a dataset already has. On a dashboard it never changes what a dataset reads; to read a source differently, edit the source in the Data pane.
The All pages filters are listed under Parameters too, as fixed ones ("All pages (fixed)"): every page keeps only their values.
Visual conditions: "Show only rows where"#
Every visual except Text and Filter has Show only rows where in its Visual pane: "A filter for this visual alone. Page filters and Filter visuals still apply on top."
+ Add condition, then pick a column, a comparison and a value. With two or more, All (and) (every condition has to hold, the default) or Any (or). ""is" takes a comma-separated list; days count from the start of today." × removes one. The same editor sets a printable report's Only rows where, a Filter visual's conditions and a number block on the Filters tab.
| Column type | Comparisons |
|---|---|
| Text | is (comma-separated list, e.g. "Late, Critical"), is not, contains, is blank, is not blank |
| Number | is more than, is at least, is less than, is at most, is, is not, is between, is not blank, is blank |
| Date | is in the next n days, is in the last n days, is before today, is today or later, is after, is on or after, is before, is on or before (YYYY-MM-DD), is, is not (the whole day), is between, is not blank, is blank |
Text comparisons ignore case, here and in every filter: picking "North" also keeps rows that say "north". A number matches however it is written (250 and 250.0). Relative date conditions are worked out again each day.
Filtering dates#
- Filters tab: tick individual dates or months.
- Filter visual: pick values, a Range slider, Conditions on dates, or Year and month.
- Visual conditions: relative windows (next/last n days, before today, today or later) or before/after a date.
- Grouped dates: a visual can group a date axis by day, week, month, quarter or year (Group dates by, see Visual options). Clicking "Mar-26" in such a visual picks every date in March 2026.
- A month filter matches every date in that month, and a date filter matches the month it falls in, so month and date columns filter each other sensibly.
- Snapshot datasets: visuals normally show the latest snapshot; a page filter on the snapshot column chooses which snapshot they show. See Snapshots and versions.
Cross-filtering: clicking a visual#
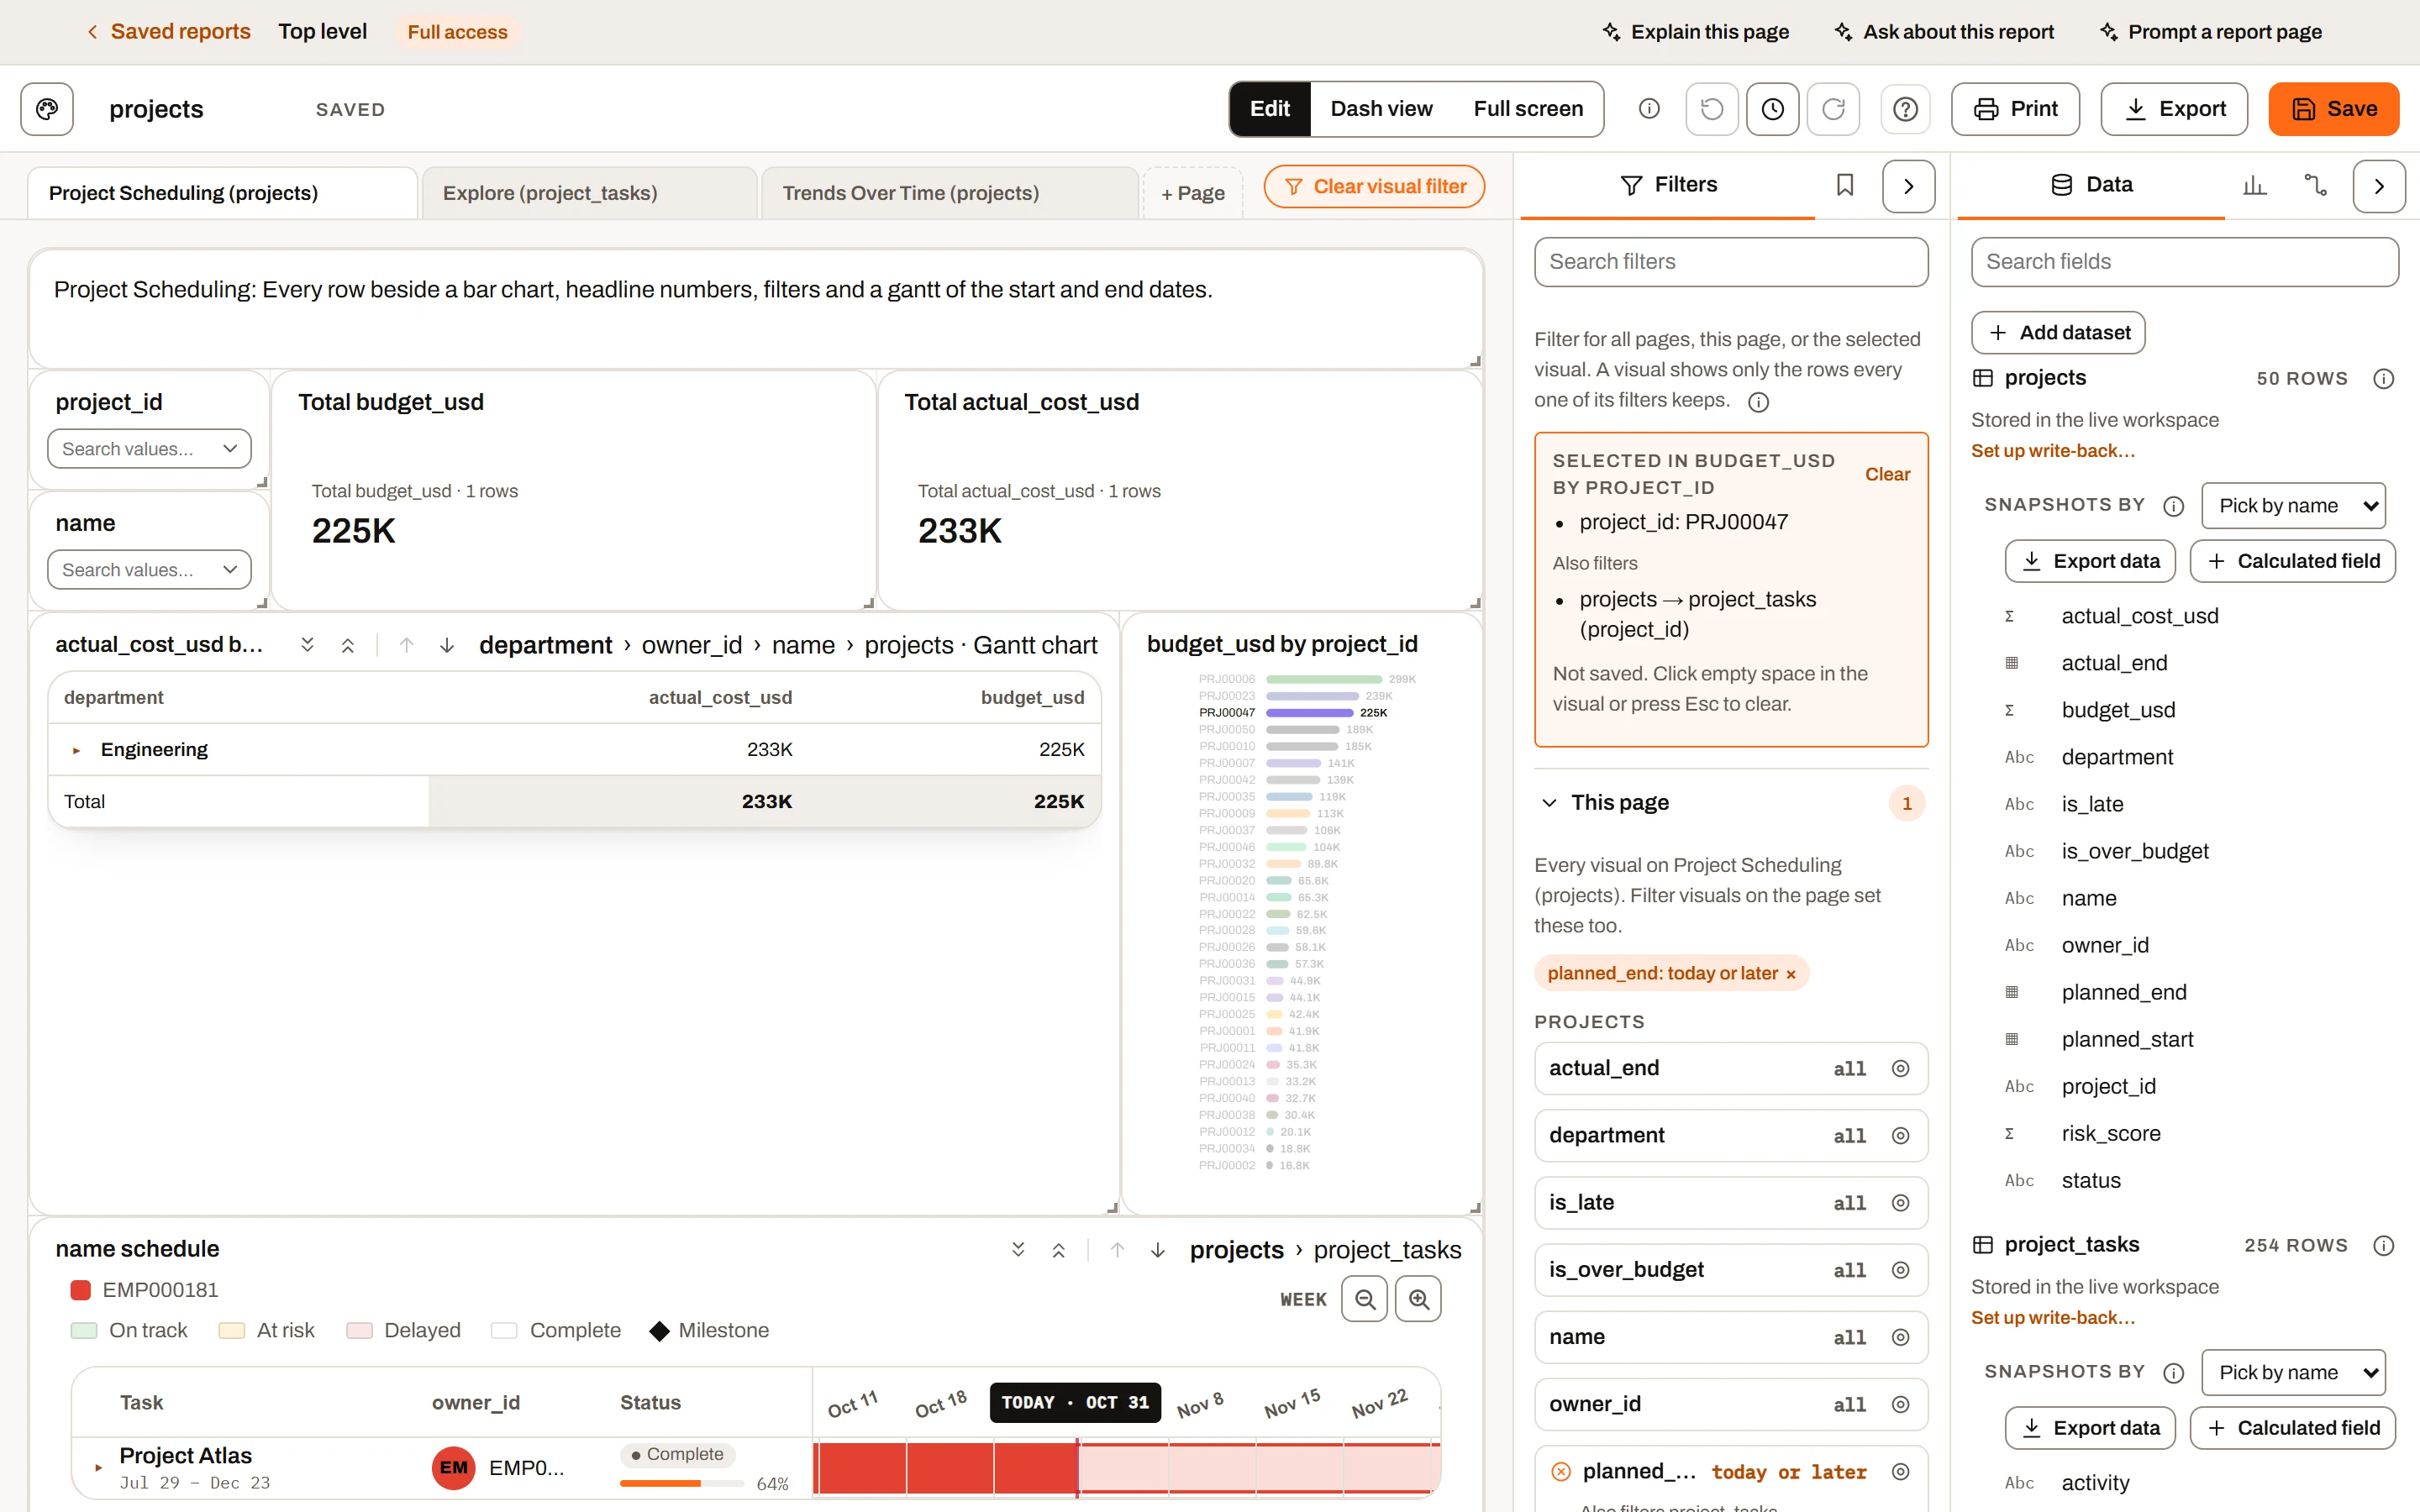
A clicked bar: the other bars fade, and the rest of the page filters to it.
Click a bar, slice, column, cell, dot, task or grid row, and the page's other visuals filter to it, as if you'd picked that value in a Filter visual. The clicked visual keeps showing everything, but fades what you didn't pick (line and area charts draw a band behind the picked point). Works in Edit and Dash view, for anyone who can open the report.
Which visuals take part#
- Can start a selection: every type except Text, KPI card, Scorecard, Gauge and Filter.
- Can be filtered by one: every type except Text.
- Each visual has two switches under Interactions in its Visual pane, both on for a new visual: Cross-filter other visuals (clicks here filter the page) and Filtered by other visuals (this visual follows clicks elsewhere). A visual with the second off shows Ignores selection while a selection would otherwise change it.
Picking#
- A click picks that mark. Clicking it again (when it's the only pick) clears.
- Ctrl+click (Cmd on a Mac) adds or removes marks within the same visual.
- A click in a different visual replaces the selection: one source per page.
- Keyboard: focus a mark (Tab) and press Enter or Space.
- What a click picks: the category, as the visual groups it (a month, a number range like "0-30"); a stacked segment or heat-map/matrix cell picks both its row and column values; "Other" in a pie, treemap or Pareto picks everything it holds; a histogram bar picks its range; a grid row, or a scatter dot without a label or colour field, picks exactly those rows; a gantt task picks rows with that task; a waterfall's total picks nothing.
How far it reaches#
- It filters visuals on the clicked visual's dataset.
- It then travels along the report's connections from the "one" side to the "many" side (one-to-one either way), and on from there. Example: clicking a customer filters that customer's orders, then those orders' lines.
- It never travels back up, and never crosses a many-to-many connection. Where it stops, the Filters tab says "Stopped at connection: neither side is unique on the connected fields, so the selection can't say which rows it means."
- A dataset reached two ways keeps only rows both allow.
- Only the click-selection travels; page filters stay on their own dataset.
- A grid's nested rows are filtered too; Filter visuals list only the values the selection leaves.
See Datasets for connections.
Seeing and clearing it#
- Clear visual filter appears at the right of the page tabs, in both modes; its tooltip names the source visual.
- In Edit mode, the Filters tab shows "Selected in visual", each pick ("Region: North", "Row: South · 1 · Closed"), "Also filters" with the connected datasets reached, and Clear. "Not saved. Click empty space in the visual or press Esc to clear."
- Clear it by clicking empty space in the source visual, pressing Escape there, Clear visual filter, or Clear in the Filters tab.
- It is cleared automatically if the source visual is deleted, has Cross-filter other visuals turned off, or changes its fields; and when you open another report.
- It is never saved and isn't part of undo/redo. Each page keeps its own while the report is open.
Tooltips#
Hover over (or tab to) any bar, slice, point or cell to see its exact values in a tooltip, the same values the chart draws. The tooltip stays with its mark while the page scrolls. A visual can show part of another page as its tooltip instead (see Page tooltips).
Drill-through#
Drill-through opens a detail page filtered to what you right-clicked. Right-click a bar for the West region, pick Drill to Customer detail, and that page opens showing only West's customers.
Setting up a drill-through page#
- Open the page that should show the detail, and the Filters tab's This page section (Edit mode).
- Click the target button at the right of a column's block. It becomes a drill-through filter: the block moves to the top, with an orange border, and a Drill-through box appears above it.
- Add as many as you like. Each column has to come from the first one's dataset or a dataset connected to it (Connections pane); the button is greyed out for the others. A column whose connection is later removed keeps its place with a dashed border and a warning.
- Click the target button again to stop a column taking drills. Its filter, if any, stays as an ordinary page filter.
The Drill-through box says what visuals offer and holds two settings:
- Offer from visuals by default (on): whether visuals on other pages offer this page without being told to. Each visual can override it (Visual pane, Interactions, Drill-through: Page default, Offer or Don't offer).
- Tooltip area: see Page tooltips.
A drill-through page is often one you don't want in the page tabs. Hide it (see Hidden pages).
Drilling#
Right-click a bar, slice, point, cell or grid row in a visual on another page whose data is the drill page's, or connected to it. The menu lists Drill to page for each drill-through page, with what each of its filters would be set to ("Customer = C1 · Status: 3 values"). Pick one to open the page with those filters set. It is one undo step, and undoing it goes back to where you were. With the keyboard, focus a mark and press Shift+F10 or the Menu key.
Each drill-through filter is set from the rows behind what you clicked:
- A column of the clicked visual's own data is set to the values those rows hold. A bar for "Open" sets Status to Open; a month sets the dates in that month.
- A column of connected data is followed through the connections: from an order up to its customer and the customer's region, or from a customer down to their orders. A date bar on an orders chart sets Customer to every customer with an order that month.
- A number the visual groups into ranges ("0-30") sets a minimum and a maximum instead.
- A column on a dataset that is only a sibling of the clicked one (another child of the same parent: a customer's visits, when you clicked one of their orders) is left unfiltered, as "all".
- When nothing is related, the filter is set so the page shows nothing on it: "(no related rows)".
A page whose filters are all on unrelated data is still listed, greyed out, with the reason.
Clearing drilled values#
Drilled values stay on the page until the next drill onto it, or until you clear them. While the open page has any, Clear drill filters appears at the right of the page tabs, beside Clear visual filter. You can also remove their chips in the Filters tab like any other filter.
Hidden pages#
In Edit mode, the eye button on a page's tab (or right-clicking the tab) hides the page:
- In Dash view it has no tab. It is reached by a drill-through or a Button that goes to it. While it is open, its tab shows (italic, with a crossed-out eye) so you can see where you are.
- In Edit mode its tab stays, dimmed and italic.
- It is never printed.
- Someone who can only view the report, or opens it from a link, never starts on it: they land on the first page that isn't hidden.
Page tooltips#
A drill-through page can lend part of itself to other visuals as their tooltip, filtered to the mark under the pointer: a small customer card that shows when you hover over a customer's bar.
- On the drill-through page, Filters tab, This page, Drill-through box: Select area, then drag a box around the part of the page to show. The box snaps to the grid's cells as you drag, as a visual does when you move it, and shows its size; afterwards it shows as a dashed orange outline in Edit mode, fixed to those cells. Select again redraws it, Clear removes it, Esc cancels.
- On a visual on related data, Visual pane, Interactions, Tooltip: pick the page (pages need a tooltip area and drill-through filters on related data to be listed).
- Set Tooltip width, in % of the page's width (30% to start) or in pixels. The height follows the area's shape.
Resting the pointer on a mark for a moment shows the area beside the pointer, following it as it moves, its visuals filtered as a drill from that mark would filter them, in place of the chart's own tooltip. Nothing is changed on the page itself. It goes when the pointer leaves the mark, on a click, a scroll or a key press.
Sorting in visuals#
- Charts: many types have a Sort setting: Largest first, Smallest first, Sheet order, Sheet order, reversed (bar, diverging bar, bullet, scorecard; box plot as "Sort by median"). Stacked bars can sort by total, funnels by value. A category limit applies after sorting. See Visual options.
- Grids: click a column header to sort ascending, again for descending. Ctrl+click another header to add it as a second sort (headers show their order). Turn on Column filters for a filter box and value list under each header, which filters only that grid.
- Matrix (cross-tab): click a column header to sort, again to reverse.
Drill down#
A Grid, Gantt chart or Matrix with nested visuals, and a Matrix with several Rows fields, can be drilled through its levels:
- A matrix drills down its Rows first, as a Power BI hierarchy does: with Rows Region, Product, Month, the first drill shows the matrix by Product (every region together), the next by Month, and only then its nested visuals. The breadcrumb names each step after its field ("Region › Product › Month › Tasks").
- Drill down takes the top layer off the visual: the next level down becomes the visual, drawn as its own Grid, Gantt chart or Matrix across the whole tile, and the levels below it still open under its rows. It shows every row of that level under the rows the layer above showed, so the page's filters and other visuals' selections still narrow it.
- Drill up puts the layer above back, one at a time, up to the visual's own layer. Drilling only goes down the levels the visual has; it stops at the last one.
- Where: the up and down arrows and the breadcrumb in the tile's header ("Projects › Tasks › Time entries", the layer shown in bold; click a layer to go straight to it), Drill down to and Drill up to in a mark's right-click menu, or Alt+Down and Alt+Up while the tile has focus. When two layers are on the same dataset, the breadcrumb adds the visual type ("Tasks · Gantt chart").
- Cross-filtering works at every level: clicking a mark in a drilled visual filters the page from the level it shows, and other visuals' selections filter it. Drilling clears the visual's own selection, since it named values of the layer it left.
- Saved: someone who can edit the report saves the level it is drilled to, so the report opens there for everyone (it isn't an undo step). Someone who can only view it drills for their session only.
- The Visual pane's Nested visuals section says which level the visual shows, with Back to the top.
- Expand all and Collapse all sit beside the drill arrows on a visual whose rows open (a matrix expanding its Rows, or any visual with nested visuals). Expand all opens every row of the next layer that isn't fully open: the top level's rows, then the next level's, then the nested visuals under the last level. Collapse all closes the deepest open layer. They change what is open on screen only; nothing is saved.
To look at one value in detail without nesting, click it to cross-filter the page, change the visual's Group dates by or fields, or set up a drill-through page.
Clearing everything#
- Report, page and visual filters: Clear all in each section of the Filters tab, Clear on each Filter visual or block, or × on a chip.
- Click-selection: Clear visual filter, or Escape in the source visual.
- Drilled values: Clear drill filters at the right of the page tabs.
- Visual conditions: × beside each condition in the Visual pane.
Filters and row access#
Row access is set on a dataset by an admin (Plus and Ultimate) and decides which rows each person can see at all. See Datasets.
- Rows you can't see never reach your browser. Every filter, click-selection, Filter-visual list, total and export works within your rows only.
- Filters can only narrow further; nothing in a report can show rows row access hides.
- A Filtered to your row access chip on the report says which datasets are limited for you.
- Two people with different access opening the same report and filters see different numbers.
- Guests and public-link visitors see the rows of the group set for them.
- A click-selection travelling through a connection stays within what you can see on both sides.
Viewers and saving#
- People who can only view a report can still use Filter visuals, click-selections, drill-through, drill down and up, and tooltips in Dash view; nothing they change is saved, so drilled values and drill levels are gone when they reopen the report.
- Editors' report, page and visual filters and Filter visual selections are saved with the report, so everyone opening it starts with them. Click-selections are never saved.
Plan limits summary#
| Feature | Free | Mini | Plus | Ultimate |
|---|---|---|---|---|
| Filters tab: all pages, page and visual filters | Yes | Yes | Yes | Yes |
| Filter visual (all modes) | Yes | Yes | Yes | Yes |
| "Show only rows where" | Yes | Yes | Yes | Yes |
| Cross-filtering by clicking | Yes (on the visual types the plan offers) | Yes | Yes | Yes |
| Cross-filtering across connected datasets | Yes (report connections) | Yes | Yes | Yes |
| Drill-through, hidden pages and page tooltips | Yes | Yes | Yes | Yes |
| Filters saved with the report | No (nothing saved) | Yes | Yes | Yes |
| Snapshot-column filtering | No | No | No | Yes |
| Row access | No | No | Yes | Yes |