
Docs › Build reports
Visual types
A report page is built from visuals: charts, cards, tables, filters, text, pictures, shapes, buttons and QR codes. This guide describes all 33 visual types in Insight FastPass: what each one is good for, which fields it needs, how it turns your rows into numbers, and what to expect when you first add it.
For every setting in the visual pane (titles, number formats, colours, fonts and the per-type switches), see Visual options. For how to place visuals on the canvas, resize them and work with pages, see Report builder. For page filters, Filter visuals and click-to-filter (cross-filtering), see Filters and interactions.
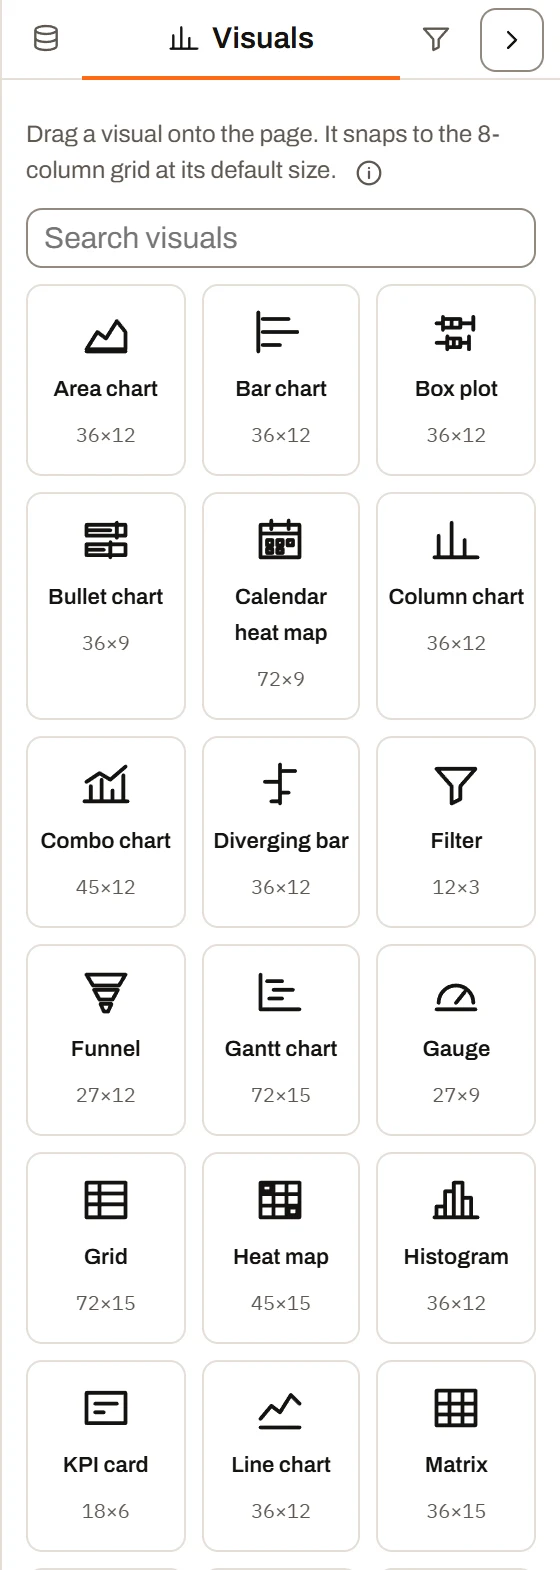
The Visuals pane.
How visuals work#
Adding a visual#
Open the Visuals tab in the rail on the left of the report builder. It lists every visual type your plan includes, sorted A to Z, with a search box (Search visuals) at the top. Each card shows the visual's name and its starting size in grid units (for example 36×12).
- Drag a card onto the page to place it where you drop it, or
- Double-click a card (or select it and press Enter) to add it at the first free spot on the current page.
The new visual is selected straight away, so its settings open in the visual pane on the right.
When the report has a dataset, a new visual fills itself in with a sensible first guess: the first number column goes into its value well and the first text or date column goes into its category well. Some types go further: a scatter plot, bullet chart and diverging bar take a second number column, a heat map takes a second category, a combo chart puts a second number column on its line, a Gantt chart looks for columns named like task, start, end, status, owner and progress, and a scorecard, box plot or Pareto chart picks a column with only a handful of distinct values to group by. You can change any of these.
Field wells#
Each visual has one or more field wells in the visual pane (under Fields). You fill them by dragging columns from the Data tab. Wells come in three kinds:
| Well takes | What you can drop | If you drop the wrong kind |
|---|---|---|
| A number field | Number columns (and Summary Calculations) | A message such as "Value takes a number field" |
| A text or date field | Anything that is not a number (text, dates, months) | A message such as "Rows takes a text or date field" |
| Any field | Any column | Always accepted |
A single-field well swaps its field when you drop a new one. A multi-field well (for example Values on a line chart) adds the field where you drop it, and you can drag its chips to reorder them. Dropping a field from a different dataset moves the whole visual onto that dataset (fields the two datasets share are kept).
The Axis / category well on most charts takes any field, including numbers. When you put a number column on the axis, a Number ranges setting appears so you can group the numbers into buckets (see Visual options).
Rolling rows up#
Most charts group your rows by a category and roll each group up into one number. The Roll up setting chooses how:
| Roll up | What it does |
|---|---|
| Sum (default) | Adds the values in each group |
| Count of rows | Counts the rows in each group. No value field is needed. |
| Average | The mean of the values in each group |
| Minimum | The smallest value in each group |
| Maximum | The largest value in each group |
A few visuals do not roll up at all and draw one mark per row: the Scatter plot, Histogram, Box plot, Gantt chart and Grid.
All rolled-up numbers are worked out from the rows left after the page's filters, any Filter visuals, any selection made by clicking another visual, and the visual's own Show only rows where conditions.
Dates on an axis#
When a date column is on a visual's axis, the Group dates by setting appears. Its choices are Every date (no grouping, the default), Day, Week, Month, Quarter and Year. Grouped dates are labelled like this:
| Grouping | Label example |
|---|---|
| Day | 2026-09-28 |
| Week (weeks start on Monday) | Wk Sep 21 '26 |
| Month | Sep-26 |
| Quarter | Q3 2026 |
| Year | 2026 |
If your dataset stacks snapshots (see Snapshots and versions) and the snapshot date is on the axis, it is never grouped: each snapshot stays its own point, so a backlog measured weekly is not added up four times in a month.
When a visual has nothing to show#
Until its required wells are filled, a visual shows a short prompt on the page instead of a chart, for example "Pick a field and measure in the Data pane" or "Pick a task, start and end in the Data pane". The prompt for each type is listed in its section below.
If the visual's dataset is no longer loaded (for example a spreadsheet that has to be uploaded again each session), the visual shows "The sheet name is not loaded. Upload it again or pick another in the Data pane."
Long lists: top-N, "Other" and hidden limits#
Visuals deal with long category lists in one of three ways:
- Folded into "Other": the Pie chart, Treemap and Pareto chart name the largest categories and add the rest together into one grey Other slice, tile or column. Clicking "Other" selects all the categories inside it.
- Cut off: the Bar chart, Column chart, Stacked column, Stacked bar, Diverging bar, Bullet chart, Box plot and Scorecard draw only the first N categories (after sorting) and leave the rest off. Nothing tells the reader that categories were left off.
- Stacked by a field: the stacked charts keep only the eight largest values of the Stack by field and leave the smaller ones off.
Each visual's section gives its default limit. Some visuals also have a fixed drawing limit that you cannot change; these are collected in Fixed display limits.
Which visual should I use?#
| Your question | Good choices |
|---|---|
| What is the one headline number? | KPI card, Gauge (against a range) |
| What is the headline number for each team, region or product? | Scorecard |
| Which categories are biggest? | Bar chart (long names, many categories), Treemap |
| How does a value change over time? | Line chart (one or more series), Area chart (one series, emphasises volume), Column chart (periods as bars) |
| How do two measures compare over time when they use different units? | Combo chart (columns on the left axis, lines on the right) |
| What is the share of the whole? | Pie chart (a few categories), Treemap (many categories), Stacked column / Stacked bar with Show as percent of total |
| How does the mix change over time? | Stacked area, Stacked column |
| Which few causes make up most of the total? | Pareto chart |
| How did we get from the start to the end total? | Waterfall |
| How far is each category above or below a target or baseline? | Diverging bar, Bullet chart |
| Is each category on target? | Bullet chart |
| Do two numbers move together? | Scatter plot (add Size by for a bubble chart) |
| How are values spread out? | Histogram (one measure), Box plot (spread per category) |
| Where are the hot spots across two categories? | Heat map |
| Which days are busy? | Calendar heat map |
| How do regions compare? | Region map |
| How many make it through each stage? | Funnel |
| What is the schedule, and what is late? | Gantt chart |
| What are the totals for rows by columns? | Matrix |
| I need to see, sort or edit the actual rows | Grid |
| Let readers pick what the page shows | Filter |
| A heading or a note on the page | Text |
| Take readers to a bookmark, another page or a website | Button |
| A code phones can scan: a link or text, typed in or built from the data | QR code |
Plan availability at a glance#
Plan availability: Free and the no-account trial at /try include ten core visual types: KPI card, Bar chart, Column chart, Pie chart, Grid, Filter, Text, Image, Shape and Button. Mini, Plus and Ultimate include all 33 types. Visual types your plan does not include are not shown in the Visuals tab.
A visual of any type that is already on a report (for example a report someone shared with you) still draws for everyone who can open it. People viewing a shared report link see every visual type.
The visual types#
The sections below follow the order the types are defined in. In the Visuals tab they are sorted alphabetically.
KPI card#
Best for: one headline number, such as total revenue, open orders or average days late.
Fields:
| Well | Takes | Required |
|---|---|---|
| Value | A number field | Yes, unless Roll up is Count of rows |
| Sparkline along | A date or category | No |
| Goal | A number field | No |
How it rolls up: the value field is rolled up over every row in view (default Sum). With a sparkline, the same roll-up is worked out for each point along the sparkline field (grouped with Group dates by when it is a date).
Notable behaviour:
- The caption above the number is written for you, for example "Total Revenue · 1,240 rows" (it always includes the row count). Type your own in Caption to replace it.
- With a sparkline and Show change vs previous point, the card shows the change from the sparkline's second-to-last point to its last one, for example "+4% vs previous month". It is green when it moves the good way (set with Higher is better). When the value is formatted as a percent, the change is shown in points ("+6 pts") rather than a percent of a percent.
- With a Goal, the card shows a meter reading, for example "1.2M of 1.5M target", in place of the change. Type a fixed goal in the pane, or drag a number field (a budget or target column) into the Goal well: it is rolled up over the same rows as the value (summed when the card counts rows), and the typed goal steps aside.
- The card can show a calculated metric (such as Win rate % or Gross margin %) instead of a single column. See Visual options. A metric with nothing to divide by shows a dash rather than 0.
- Empty-state prompt: "Pick a measure in the Data pane".
Example question: "What is our total open order value this month, and is it up or down on last month?"
Plan availability: all plans.
Scorecard#
The Scorecard is a group of KPI cards: one card per value of a category, laid out in a row that wraps.
Best for: the same headline number for each region, team, product line or project.
Fields:
| Well | Takes | Required |
|---|---|---|
| A card for each | Any field | Yes |
| Value | A number field | Yes, unless counting rows |
| Sparkline along | A date or category | No |
How it rolls up: the value is rolled up for each card's category. With a sparkline, each card gets its own trend line worked out from its own rows.
Notable behaviour:
- Cards are sorted Largest first by default, and at most 8 cards are drawn (Max cards; 0 draws one per category).
- Show change vs previous point appears only once a sparkline field is set. Each card then shows its own change.
- Cards share the width of the tile, between about 130 and 260 pixels each.
- Empty-state prompt: "Pick a field and measure in the Data pane".
Example question: "What is the revenue for each region, and which regions are growing?"
Plan availability: Mini, Plus and Ultimate.
Bar chart#
Horizontal bars, one per category.
Best for: ranking categories, especially when names are long or there are many of them.
Fields:
| Well | Takes | Required |
|---|---|---|
| Axis / category | Any field | Yes |
| Value | A number field | Yes, unless counting rows |
How it rolls up: one bar per category, rolled up with Roll up (default Sum). Dates can be grouped and numbers split into ranges.
Notable behaviour:
- Sorted Largest first by default. At most 30 bars are drawn (Max categories, 0 keeps every category); the rest are left off after sorting.
- Negative values run left from a zero line.
- Each bar gets its own colour by category unless you turn off Color each bar.
- You can add a dashed target line, and flag bars at or above, or at or below, a threshold in an attention colour (a small legend explains the flag).
- The bars stretch to fill the tile's height; you can set their thickness and the gap between them.
- Can show a calculated metric instead of a column.
- Empty-state prompt: "Pick a field and measure in the Data pane".
Example question: "Which 10 customers bought the most last quarter?"
Plan availability: all plans.
Diverging bar#
Bars running left and right from a centre line.
Best for: showing how far each category is above or below a baseline: over or under budget, ahead or behind plan, above or below a standard price.
Fields:
| Well | Takes | Required |
|---|---|---|
| Axis / category | Any field | Yes |
| Value | A number field | Yes, unless counting rows |
| Center | A number field | No |
How it rolls up: each bar is Value minus Center. With a Center field, both are rolled up the same way for each category. Without one (or when counting rows), each bar is the value minus the fixed Center value (default 0).
Notable behaviour:
- The two sides are labelled Above and Below by default (rename them with Right side and Left side). These names appear in the legend and tooltip.
- Bad side sets which direction is coloured as the problem. The default is Right (running right is bad, as with over budget or late).
- Sorted Largest first by default; at most 20 categories (0 keeps all).
- Empty-state prompt: "Pick a field and measure in the Data pane".
Example question: "Which projects are over budget, and by how much?"
Plan availability: Mini, Plus and Ultimate.
Column chart#
Vertical columns along an axis.
Best for: values across an ordered axis, such as months, weeks or aging bands, and simple category comparisons.
Fields:
| Well | Takes | Required |
|---|---|---|
| Axis / category | Any field | Yes |
| Value | A number field | Yes, unless counting rows |
| More values (side by side) | Number fields (several) | No |
How it rolls up: one column per category, rolled up with Roll up. With More values, each extra number field is drawn as its own column beside the first (a clustered column chart), all on one shared axis, so keep them in the same unit.
Notable behaviour:
- Columns stay in the dataset's order (the axis is usually time). At most 30 columns are drawn (Max categories); the cap keeps the first 30 in order, not the largest.
- Value labels show on the First and last columns by default.
- A single-series column chart colours each column by category unless you turn off Color each column or turn on Shade light to dark along the axis. A clustered chart colours by value field and shows a legend.
- More values is ignored when counting rows or when a calculated metric is used.
- Can show a calculated metric instead of a column.
- Empty-state prompt: "Pick a field and measure in the Data pane".
Example question: "How many orders did we ship each month this year?"
Plan availability: all plans.
Line chart#
One or more lines along an axis.
Best for: trends over time, and comparing several measures (for example actual against forecast).
Fields:
| Well | Takes | Required |
|---|---|---|
| Axis / category | Any field | Yes |
| Values | Number fields (several) | At least one, unless counting rows |
| Split by | A text or date field | No |
| Target line | A number field | No |
How it rolls up: each value field is rolled up per axis point with the one Roll up setting, and drawn as its own line. With Split by, the first value is drawn once for each value of that field instead (a line per region).
Notable behaviour:
- The value axis does not start at zero unless you tick Start axis at zero.
- Any line can be drawn dashed (for a plan or forecast).
- A Target line field is rolled up the same way and drawn as a dashed neutral line. Without a field, you can type a fixed target value instead.
- Lines show a dot on each point and a label at their end, unless switched off.
- A legend appears when there is more than one line or a target line.
- Split by draws the eight largest of the field's values as lines of their own and adds the rest together as Other (set Named lines in the pane; empty draws them all, up to 24). The lines take the field's value colours, shared with other visuals on the same field. A target line and dashes are left off while the line is split.
- Can show a calculated metric instead of the value fields.
- Empty-state prompt: "Pick a field and at least one measure in the Data pane".
Example question: "How are actual sales tracking against the forecast month by month?"
Plan availability: Mini, Plus and Ultimate.
Pie chart#
Slices of a circle, drawn as a donut by default.
Best for: share of a whole when there are only a few categories.
Fields:
| Well | Takes | Required |
|---|---|---|
| Slices | Any field | Yes |
| Value | A number field | Yes, unless counting rows |
How it rolls up: one slice per category, rolled up with Roll up, largest first.
Notable behaviour:
- Every category gets its own slice by default (Named slices empty or 0), up to a hard limit of 48 named slices. With a number set, the rest are added together into an Other slice.
- A donut shows the total in its middle (switch off with Total in the middle).
- Slices show their percent of the total.
- The legend sits on the Left by default.
- Slice colours are kept per category value and can be shared with other visuals.
- Empty-state prompt: "Pick a field and measure in the Data pane".
Example question: "What share of revenue comes from each sales channel?"
Plan availability: all plans.
Combo chart#
Columns and lines over one axis, with the lines read against a second axis on the right.
Best for: two related measures in different units, such as revenue (columns) and margin % (line), or orders and average order value.
Fields:
| Well | Takes | Required |
|---|---|---|
| Axis / category | Any field | Yes |
| Column values | Number fields (several) | At least one column or line value, unless counting rows |
| Line values | Number fields (several) | No |
How it rolls up: every column and line value is rolled up per category with the one Roll up setting. When counting rows, the count is drawn as columns and the line values are ignored.
Notable behaviour:
- The line values get their own number format (Line format) because they sit on their own axis.
- Line values can be drawn dashed.
- Dates can be grouped, but number axes cannot be split into ranges on this type.
- At most 40 categories are drawn (fixed).
- Empty-state prompt: "Pick a field and at least one measure in the Data pane".
Example question: "How do monthly revenue and gross margin % move together?"
Plan availability: Mini, Plus and Ultimate.
Area chart#
One filled line.
Best for: a single measure accumulating over time, where the volume under the line matters.
Fields:
| Well | Takes | Required |
|---|---|---|
| Axis / category | Any field | Yes |
| Value | A number field | Yes, unless counting rows |
How it rolls up: one point per axis value, rolled up with Roll up.
Notable behaviour:
- An end label shows the last value (switch off with End label).
- Empty-state prompt: "Pick a field and measure in the Data pane".
Example question: "How has our open backlog value changed week by week?"
Plan availability: Mini, Plus and Ultimate.
Stacked area#
Filled bands stacked on top of each other.
Best for: how the mix of a whole changes over time, such as work by status month by month.
Fields:
| Well | Takes | Required |
|---|---|---|
| Axis / category | Any field | Yes |
| Stack by | A text or date field | No |
| Values | Number fields (several) | At least one, unless counting rows |
How it rolls up: with Stack by, the first value field is split by that field's values, one band per value. Without it, each value field is its own band.
Notable behaviour:
- Stack by keeps only the eight largest values of the field (by total); smaller ones are left off.
- Show as percent of total draws each point as shares of 100%; the tooltip still shows the real values.
- Empty-state prompt: "Pick a field and at least one measure in the Data pane".
Example question: "How has the mix of open, in-progress and closed jobs changed over the year?"
Plan availability: Mini, Plus and Ultimate.
Stacked column#
Vertical columns split into stacked segments.
Best for: parts of a whole for each category or period.
Fields:
| Well | Takes | Required |
|---|---|---|
| Axis / category | Any field | Yes |
| Stack by | A text or date field | No |
| Values | Number fields (several) | At least one, unless counting rows |
How it rolls up: as the stacked area: with Stack by the first value is split by the field's values; without it each value field is a segment.
Notable behaviour:
- At most 30 columns (Max categories).
- Stack by keeps the eight largest values.
- Each column shows its total above it (Total labels), except when shown as percent of total.
- Show as percent of total turns each column into shares of 100% and switches the axis to percent.
- Layout: Side by side draws the stack's parts as columns next to each other, each from the axis, with the axis reaching the largest single value and each column's value on top while there is room. Percent of total applies only to the stacked layout.
- Empty-state prompt: "Pick a field and at least one measure in the Data pane".
Example question: "How many tickets were opened each week, split by priority?"
Plan availability: Mini, Plus and Ultimate.
Stacked bar#
The horizontal version of the stacked column, for named categories.
Best for: comparing the make-up of named items, such as open work by owner split by due status.
Fields:
| Well | Takes | Required |
|---|---|---|
| Axis / category | Any field | Yes |
| Stack by | A text or date field | No |
| Values | Number fields (several) | At least one, unless counting rows |
How it rolls up: as the stacked column.
Notable behaviour:
- At most 12 bars (Max categories), sorted Largest total first by default (switch off to keep the field's order). Sorting by total is turned off while showing percent of total.
- Shade stacks light to dark colours the segments along a single-colour ramp, useful for ordered stacks such as aging buckets (0-30, 31-60, 61-90 days).
- Layout: Side by side lays the parts one under another in each bar's band, each from the axis, with its own value at its end.
- Stack by keeps the eight largest values.
- Empty-state prompt: "Pick a field and at least one measure in the Data pane".
Example question: "How much open work does each project manager have, split into on time and overdue?"
Plan availability: Mini, Plus and Ultimate.
Pareto chart#
Columns sorted largest first, with a line showing the running share of the total.
Best for: finding the few causes behind most of a problem, such as the defect types behind most rework.
Fields:
| Well | Takes | Required |
|---|---|---|
| Axis / category | Any field | Yes |
| Value | A number field | Yes, unless counting rows |
How it rolls up: only Sum or Count of rows (a running share only makes sense for these). Columns are sorted largest first and the line, read on a right-hand percent axis, is the share of the total reached by each column, ending at 100%.
Notable behaviour:
- 10 named columns by default (Named columns; empty or 0 draws all). The rest fold into an Other column, so the line still ends on 100%.
- Zero and negative values are left out, since they have no share of a whole.
- The line is called Cumulative % in the legend.
- Empty-state prompt: "Pick a field and measure in the Data pane".
Example question: "Which three reasons account for 80% of our returns?"
Plan availability: Mini, Plus and Ultimate.
Waterfall#
Steps up and down from one category to the next, ending on a total.
Best for: explaining how a starting figure became an ending figure, such as the changes that make up a month's profit.
Fields:
| Well | Takes | Required |
|---|---|---|
| Axis / category | Any field | Yes |
| Value | A number field | Yes, unless counting rows |
How it rolls up: each category is rolled up and drawn as a step up (positive) or down (negative) from where the previous step ended. A closing Total bar, the sum of the steps, is added at the end and drawn from zero.
Notable behaviour:
- Steps keep the dataset's order, so arrange your data in the order the story should be told.
- The legend shows Increase, Decrease and Total.
- Thin lines join each step to the next (Lines between steps).
- Clicking the Total bar does not filter other visuals.
- Empty-state prompt: "Pick a field and measure in the Data pane".
Example question: "What took us from budgeted profit to actual profit this quarter?"
Plan availability: Mini, Plus and Ultimate.
Scatter plot#
One dot per row, placed by two numbers.
Best for: seeing whether two measures move together, and spotting outliers. Add Size by to make a bubble chart.
Fields:
| Well | Takes | Required |
|---|---|---|
| X axis | A number field | Yes |
| Y axis | A number field | Yes |
| Size by | A number field | No |
| Color by | A text or date field | No |
| Dot label | A text or date field | No |
How it rolls up: it does not. Every row in view is its own dot.
Notable behaviour:
- Size by sizes each dot's area by its number.
- Color by colours dots by category and adds a legend.
- Dot label names each dot (in the tooltip). Clicking a dot selects every row with the same label (or the same colour when there is no label, or just that row when there is neither).
- Both axes start at zero unless you untick Start axes at zero.
- Trend line adds a straight line of best fit.
- Above 2,000 rows, an evenly spaced sample of rows is drawn.
- Empty-state prompt: "Pick an X and Y measure in the Data pane".
Example question: "Do larger jobs have lower margins?"
Plan availability: Mini, Plus and Ultimate.
Histogram#
Columns counting how many rows fall into each range of a number.
Best for: the shape of a distribution, such as how order values or lead times are spread.
Fields:
| Well | Takes | Required |
|---|---|---|
| Values to bin | A number field | Yes |
How it rolls up: the value range is split into equal-width bins (Bins, default 8, from 2 to 60) with rounded edges, and each column counts the rows in its bin. The count axis is labelled "Rows".
Notable behaviour:
- Grid lines are off by default on this type.
- There is no number format or decimal setting.
- Empty-state prompt: "Pick a measure in the Data pane".
Example question: "How many orders fall into each price band?"
Plan availability: Mini, Plus and Ultimate.
Box plot#
Box-and-whisker rows showing how one measure is spread within each category.
Best for: comparing spread and typical values across categories, such as delivery times by supplier.
Fields:
| Well | Takes | Required |
|---|---|---|
| A box for each | Any field | No (without it, one box covers every row) |
| Values to spread | A number field | Yes |
How it rolls up: it does not roll up. Each box is drawn from the raw rows in its category: the box holds the middle half of the values with a line at the median, and the whiskers reach the furthest value within 1.5 times the box's length. Anything past the whiskers is an outlier.
Notable behaviour:
- At most 12 boxes (Max categories); sorting is by median (Sheet order by default).
- Outliers show as dots (at most 40 per box are drawn); Mark the average adds a mark at each box's mean.
- Numbers default to a plain number format so a median of 3.5 does not round to 4.
- Each box is coloured by category unless switched off.
- Empty-state prompt: "Pick a measure in the Data pane".
Example question: "Which suppliers have the most unpredictable lead times?"
Plan availability: Mini, Plus and Ultimate.
Treemap#
Nested rectangles sized by value.
Best for: share of a whole with many categories, where a pie would be too crowded.
Fields:
| Well | Takes | Required |
|---|---|---|
| Tiles | Any field | Yes |
| Value | A number field | Yes, unless counting rows |
How it rolls up: one tile per category, rolled up with Roll up, largest first.
Notable behaviour:
- 8 named tiles by default (Named tiles, minimum 1). The rest are added together into an Other tile. The treemap never draws more than 49 named tiles, whatever you set.
- Empty-state prompt: "Pick a field and measure in the Data pane".
Example question: "Which product lines make up our inventory value?"
Plan availability: Mini, Plus and Ultimate.
Funnel#
Stages narrowing from top to bottom.
Best for: how many make it through each stage of a process, such as leads to quotes to orders.
Fields:
| Well | Takes | Required |
|---|---|---|
| Stages | Any field | Yes |
| Value | A number field | Yes, unless counting rows |
How it rolls up: one stage per category, rolled up with Roll up. To count instead of adding up a number, set Roll up to Count of rows and leave Value empty. Each stage is then the number of rows with that value. The example above counts project tasks by activity.
Notable behaviour:
- Largest stage first is on by default. Turn it off to keep the dataset's order, which is what you want when your stages are already in process order.
- Shows the share lost between each stage and the next (Drop between stages) and the share of the first stage that reaches the last (Overall rate).
- Values show without decimals by default.
- Empty-state prompt: "Pick a field and measure in the Data pane".
Example question: "What share of quotes turn into orders?", or, counting rows, "How many tasks are at each stage?"
Plan availability: Mini, Plus and Ultimate.
Gauge#
A half-dial showing one number against a range, with red, amber and green bands.
Best for: a single number against a known scale or target, such as capacity used or on-time %.
Fields:
| Well | Takes | Required |
|---|---|---|
| Value | A number field | Yes, unless counting rows |
| Minimum | A number field | No |
| Maximum | A number field | No |
| Target | A number field | No |
How it rolls up: the value is rolled up over every row in view. The Minimum, Maximum and Target fields are rolled up over the same rows (summed when the gauge counts rows).
Notable behaviour:
- A Target field is marked on the dial as a tick with its value beside it.
- A Minimum or Maximum field sets that end of the scale in place of the typed one.
- The scale runs from Minimum (default 0) to Maximum. A Maximum of 0 (the default) rounds up from the value to a tidy number (for example 73 becomes 100, 1,240 becomes 2,000).
- Three bands, by default changing at half and three quarters of the range. Normally they run Low (red), Fair (amber), Good (green); with Lower is better they run Good, Fair, High.
- A band legend sits under the dial (Band legend).
- Can show a calculated metric instead of a column.
- Values show without decimals by default.
- Empty-state prompt: "Pick a measure in the Data pane".
Example question: "How full is the plant this week compared with capacity?"
Plan availability: Mini, Plus and Ultimate.
Bullet chart#
A bar per category against a target tick, over grey background ranges.
Best for: checking many categories against their own targets in a small space.
Fields:
| Well | Takes | Required |
|---|---|---|
| Axis / category | Any field | Yes |
| Value | A number field | Yes |
| Target | A number field | Yes |
How it rolls up: the value and target are both rolled up per category with the one Roll up setting. Dates on the axis are not grouped and numbers are not split into ranges on this type.
Notable behaviour:
- The grey ranges are fixed background context (at 50%, 80% and 100% of the scale); the bar is the thing to read.
- The tooltip shows Actual and Target.
- Sheet order by default; all categories drawn unless you set Max categories.
- Each row's bar is coloured by category unless switched off.
- Empty-state prompt: "Pick a field, value and target in the Data pane".
Example question: "Is each sales rep on track for their quota?"
Plan availability: Mini, Plus and Ultimate.
Heat map#
A grid of cells across two categories, shaded darker for larger values.
Best for: finding hot spots, such as defects by line and shift, or sales by region and month.
Fields:
| Well | Takes | Required |
|---|---|---|
| Rows | Any field | Yes |
| Columns | Any field | Yes |
| Value | A number field | Yes, unless counting rows |
How it rolls up: one cell per row-and-column pair, rolled up with Roll up. Date rows or columns can be grouped and number rows or columns split into ranges (one setting applies to both).
Notable behaviour:
- Values are not printed in the cells unless you tick Show values in cells.
- A low-to-high colour scale shows under the grid (Color scale).
- At most 50 rows and 30 columns are drawn (fixed).
- Empty-state prompt: "Pick a row field, column field and measure in the Data pane".
Example question: "Which shifts on which production lines produce the most scrap?"
Plan availability: Mini, Plus and Ultimate.
Calendar heat map#
A square per day, a column per week, shaded darker for larger values.
Best for: daily patterns, such as busy days, quiet weekends or seasonal peaks.
Fields:
| Well | Takes | Required |
|---|---|---|
| Date | A date field | Yes |
| Value | A number field | Yes, unless counting rows |
How it rolls up: rows are rolled up per calendar day.
Notable behaviour:
- Weeks start on Monday by default (or Sunday).
- The latest 53 weeks are drawn by default (Weeks shown; empty or 0 draws every week).
- Days with no rows stay empty; their tooltip says "No data".
- Day values can be printed in the squares when they are large enough (Show values in days).
- Empty-state prompt: "Pick a date and measure in the Data pane".
Example question: "Which days of the year did we receive the most service calls?"
Plan availability: Mini, Plus and Ultimate.
Region map#
One equal-sized hexagon per region, shaded by value.
Best for: comparing named regions, territories, branches or sites at a glance. This is a schematic layout, not a geographic map: every region has the same size so small regions are not lost.
Fields:
| Well | Takes | Required |
|---|---|---|
| Regions | Any field | Yes |
| Value | A number field | Yes, unless counting rows |
How it rolls up: one hexagon per region, rolled up with Roll up.
Notable behaviour:
- Hexagons are laid out in a grid in the order the regions come from the data. Hexes per row sets the grid width; 0 (the default) picks a near-square block.
- Each hexagon shows its value (Values in regions), with a colour scale underneath (Color scale).
- At most 60 regions are drawn (fixed).
- Empty-state prompt: "Pick a field and measure in the Data pane".
Example question: "Which branches have the highest sales per head?"
Plan availability: Mini, Plus and Ultimate.
Gantt chart#
One bar per row from a start to an end, on a timeline.
Best for: project schedules and task tracking: what is running now, what is late and who owns it.
Fields:
| Well | Takes | Required |
|---|---|---|
| Task | A text or date field | Yes |
| Start | Any field (dates, or plain numbers for sprints or weeks) | Yes |
| End | Any field | Yes |
| Status | A text or date field | No |
| Owner | A text or date field | No |
| Progress % | A number field (0 to 100) | No |
How it rolls up: it does not. Each row is one task bar, so a schedule sheet with a row per task reads straight in.
Notable behaviour:
- Clicking a date column in the Data tab fills Start first, then End.
- Status values are read as On track (also "in progress"), At risk (also "risk"), Delayed (also "late"), Planned (also "not started") and Complete. Spaces, dashes and underscores are ignored.
- With no Status field, every bar draws as complete.
- With an Owner field, an owner column appears and bars are coloured per owner.
- Progress % is worked out from Days elapsed by default (days since the start over the whole span). Put a 0-100 field in the Progress % well to read it from your data instead, or choose None to hide it.
- At most 40 rows (Max rows; 0 draws all). The timeline opens scrolled to today (Open at today).
- Can open a grid, Gantt chart or matrix of a connected dataset under each task, up to 4 levels deep (see Nested visuals). A nested Gantt chart lines up with this one's timeline and columns.
- Empty-state prompt: "Pick a task, start and end in the Data pane".
Example question: "Which tasks are running late, and who owns them?"
Plan availability: Mini, Plus and Ultimate.
Matrix#
A rolled-up table: rows by columns, with totals. With no column field it is a simple summary table.
Best for: exact totals across one or two categories, like a spreadsheet pivot table.
Fields:
| Well | Takes | Required |
|---|---|---|
| Rows | Text or date fields (up to five), top level first | Yes, at least one |
| Columns | A text or date field | No (none gives a flat table) |
| Values | Number fields (up to six), in the order they show | At least one, unless counting rows |
How it rolls up: one cell per row-and-column pair (or one row per category in a flat table), rolled up with Roll up. Date rows or columns can be grouped. With several Values, each gets its own column, in the well's order (under each column value, in a cross-tab); drag them within the well to reorder. Every subtotal and total is the value rolled up over the rows it stands for, so an average subtotal is the average of its rows, not a sum of the averages above it.
Several Rows fields make a hierarchy, as in a Power BI matrix: the first field in the well is the top level and each field after it is the next level down. Drag the fields within the well to change the order. The levels show one of two ways, picked under Row layout:
- Expand (the default), like Power BI's matrix: the matrix lists the first field's values, each with a caret. Opening one shows the next field's values for just that row's data right under it, in the same table, indented past a darker strip, so every value column stays lined up with the rows above; those rows open the next level in turn. Each level's strip is a shade darker (set them under Level colors). The next field's name isn't repeated over each opened row unless Show level headers is on. The rows of the last level open any nested visuals, in a band indented one level further.
- Columns (classic), like Excel's classic pivot layout: each Rows field gets its own column, every row is the whole combination of values written out (East, Bikes), and its numbers are for the rows that match all of them. Show totals adds a subtotal row after each group. Each row opens the nested visuals for its combination from the caret at the left of its first value, and in a cross-tab each cell opens them for its combination and column.
Notable behaviour:
- Show totals (on by default) adds a total column and a total row (a total row only, in a flat table).
- Shade by value (on by default) shades cells darker for larger values in a cross-tab, and draws a data bar behind each value in a flat table.
- With several Values, or several Rows fields in the classic layout, Show totals adds the subtotal rows, the total row and (in a cross-tab) a total column per value. Each value is shaded on its own scale. Rows keep each field's order (they are not sorted by clicking a heading).
- With two or more Values, Show row totals (off by default) adds a Row total column at the right that adds up each row's values: every value under every column. Turn it on when the values share a unit, such as hours by category.
- Expand all and Collapse all in the tile's header open the next layer everywhere (the top level's rows, then the next level's, then the nested visuals under them), or close the deepest open layer.
- In the expand layout, a row that opens is the total of the rows under it, so there are no subtotal rows; Show totals adds the total row at the foot.
- A row, cell or total can open a grid, Gantt chart or another matrix of the rows behind it (see Nested visuals). In the expand layout only the last level's rows do; in the classic layout each combined key's row and cells do (not the subtotals).
- Clicking a row or cell at any level filters the page by every level's value down to it.
- A cross-tab draws at most 50 rows and 30 columns (fixed); a matrix with several Values, or several Rows fields in the classic layout, draws up to 500 rows and 30 column values, and says how many rows it left off.
- The table scrolls inside its tile.
- Empty-state prompt: "Pick a row field and a measure in the Data pane".
Example question: "What is the revenue by region and quarter, with totals?"
Plan availability: Mini, Plus and Ultimate.
Grid#
The dataset's own rows in a sortable table, optionally editable.
Best for: looking up, sorting and checking the actual records, and (on plans with grid editing) updating them.
Fields:
| Well | Takes | Required |
|---|---|---|
| Columns | Any field (several) | At least one column stays |
| Status badges | Text or date fields (several) | No |
How it rolls up: it does not. It shows the rows left after the page's filters, Filter visuals, selections in other visuals and its own conditions.
Notable behaviour:
- A new grid lists every column of the dataset, calculated fields included, so you can remove the ones you do not need. Drag column headers in the grid to reorder them; the Columns well follows.
- Click a header to sort; Ctrl+click to add more sort columns.
- The first shown text column stays pinned on the left while you scroll sideways.
- Status badges draw a column as coloured pills: red for words like late, overdue, failed or blocked; amber for at risk, pending, in progress or on hold; green for done, complete, on track or approved; grey for anything else.
- Can open a grid, Gantt chart or matrix of a connected dataset under each row, up to 4 levels deep (see Nested visuals); a nested grid level has its own conditional styling.
- With Editing on, rows can be edited, added and deleted, and the changes flow to every other visual on that dataset.
- There is no totals row and no paging; long grids scroll.
- With no rows to show, the grid is empty.
Example question: "Show me every order more than 10 days late, with its customer and owner."
Plan availability: all plans. Editing a grid needs Mini or above. See Visual options.
Filter#
A filter control that readers use to filter the page. (The gallery calls it Filter; it is sometimes called a slicer.)
Best for: letting readers pick a region, a date range, a status and so on, and see every visual on the page update.
Fields:
| Well | Takes | Required |
|---|---|---|
| Field | Any field | Yes |
How it works: the values a reader picks become the page's filter on that field. How filters combine across visuals and datasets is covered in Filters and interactions.
Notable behaviour:
- Text fields offer Pick values only. Number fields also offer Range slider and Conditions (>, <, =…). Date and month fields offer all four modes, including Year and month.
- Pick values shows values as Buttons or a Drop-down (the default for new Filter visuals), single or multiple selection.
- At most 200 values are listed at once (picked values always show). Buttons say "N more values. Switch the filter to a drop-down with search to reach them."; a searchable drop-down narrows the list as you type.
- A Clear link appears once something is picked.
- Empty-state prompt: "Pick a field in the Data pane".
Example question: "Show this page for the North region in Q3 only."
Plan availability: all plans.
Text#
A block of free text: a page heading, a section heading or a note.
Best for: titles, explanations, instructions and captions on a page.
Fields: none. While editing the report, click into the text on the page and type, or switch it to Markdown and type in the selected-visual pane.
Notable behaviour:
- Three styles: Heading, Subheading and Body (the default), aligned left, centre or right.
- Format: Plain or Markdown. Plain is typed straight into the tile. Markdown is written in the selected-visual pane, with a preview under it, and the tile shows it formatted: headings, bold, italic, lists, tables, quotes and code. HTML is shown as text, images are left out, and links show their address as plain text. Figures with a leading + or − are coloured, and right-aligned figures in a table line up.
- Text visuals have no dataset, filters or interactions.
Example question: "Explain to readers what this page shows and where the numbers come from."
Plan availability: all plans.
Image#
A picture on the page: a logo, a banner, a diagram.
Best for: your logo in a corner, a header banner, a photo or a diagram that explains the page.
Fields: none. In the selected-visual pane, choose Choose a picture… (PNG, JPEG, GIF, WebP or SVG, up to 1 MB), or type the https:// address of a picture on the web. While editing, you can also drop a picture file straight onto the tile.
Notable behaviour:
- A picture file is stored in the report, so it travels with the report, its versions and an
.ifprfile. A report can store up to 8 MB of pictures in all. An address is loaded by each reader's browser, so it must be public, and the report shows whatever is at that address now. - Fit shows the whole picture inside the tile, Fill covers the tile and crops the rest, Stretch makes it exactly the tile's shape. With Fit, Align places it left, centre or right.
- A Link opens a web address when the picture is clicked in Dash view and for viewers; while editing, hold Ctrl (or Cmd) and click. Alt text is read out by screen readers and shown when the pointer rests on the picture.
- The tile has no card around it and no title, so the picture is all there is. While editing, a dashed outline shows where it is.
- An address that doesn't load shows "The picture didn't load".
- Create a printable report prints a stored PNG or JPEG; a picture from an address, an SVG, a GIF or a WebP is left out and named.
- Images have no dataset, filters or interactions.
Plan availability: all plans.
Shape#
A rectangle, a rounded rectangle, an oval or a line.
Best for: a coloured band behind a page title, a background that groups a few visuals, a divider between sections.
Fields: none. Pick the shape, its Fill and Outline in the selected-visual pane. Each colour can be picked, or follow the report's theme (Brand, Brand light, Ink, Line, Surface), or be None.
Notable behaviour:
- A new shape goes behind the other visuals on the page, so a band dropped over a title doesn't hide it. Any visual's More options menu has Bring to front and Send to back.
- The shape fills the tile edge to edge, with no card or title around it. The outline's width (up to 12) and the rounded rectangle's corner radius stay what you set however the tile is stretched.
- A line runs across, down or diagonally, solid, dashed or dotted. Opacity lets the page show through.
- Create a printable report prints a horizontal line as a rule across the page; filled shapes are left out.
- Shapes have no dataset, filters or interactions.
Plan availability: all plans.
Button#
A button that takes the reader somewhere: it opens a bookmark, goes to another page of the report, or opens a website.
Best for: navigation between pages, switching a page to a saved view ("Show Q1", "Reset filters"), and links to related documents or systems.
Fields: none. Pick what it does under On click in the selected-visual pane:
- Open a bookmark: puts the bookmark's page back as the bookmark saved it, as Open does in the Bookmarks tab.
- Go to a page: opens another page of this report.
- Open a link: opens a web address in a new tab (in the desktop app, in your browser). A bare address such as
example.comopens ashttps://example.com;mailto:andtel:links work too. Other kinds of link are refused.
Notable behaviour:
- Two quick ways to add one for a bookmark: drag the bookmark from the Bookmarks tab onto the page, or pick Add button from the bookmark's menu.
- Label is the text on the button. Left blank, it shows the bookmark's or page's name (and follows a rename) or the link's address.
- Background and Text colours; automatic text turns black or white against the fill. The label's font and size are under Fonts.
- In Dash view and for viewers, a click follows the button. While editing, a click selects it like any other visual; hold Ctrl (or Cmd) and click to try it.
- A button whose bookmark or page has been deleted shows as an outline and says so when hovered or clicked.
- Opening a bookmark replaces the page with the bookmark's copy, so a button that isn't in that copy disappears when it is clicked. To keep the buttons on the page, add them before saving the bookmark, or use Update from this page afterwards.
- Buttons have no dataset, filters or interactions.
Plan availability: all plans.
QR code#
A QR code that phones can scan: a web address or any text, typed in or built from the report's data. Printable reports have the same element (Insert > QR code).
Best for: a link to an order, an asset or a customer's page; a code on a dashboard that opens the live report; labels and tickets in a printable report.
Fields: Values, optional: the fields a code built from the data reads.
Pick where its text comes from under Content in the selected-visual pane:
- Typed in encodes the text exactly as you type it.
- From data fills a Template from the fields in the Values well. Each field becomes a value named
val1,val2and so on (rename it in the pane) and is put into the template by its name in braces:https://mvpfastpass.com/{val1}/{val2}. A field's own name in braces works too. A blank template joins the values with spaces.
Each value summarises the field over the rows the visual reads, so the code follows the page's filters and Filter visuals:
| Summary | Gives |
|---|---|
| First, Last | The first or last non-blank value, in the dataset's order |
| Lowest, Highest | Numbers and dates by value; text alphabetically, ignoring case, with numbers inside text compared by value ("Item 9" before "Item 10") |
| Count, Count distinct | How many non-blank values, or different ones |
| Total, Average | Over the values that are numbers |
Numbers are written plainly (no thousands separators) and dates as 2026-10-28.
Notable behaviour:
- Encode values for a web address (on by default) writes each value safely into a link: a space becomes
%20, a slash%2F. Turn it off when the template isn't a link or a value should keep its slashes. - Filter the page to one row (a Filter visual, a drill-through, Show only rows where) and First gives that row's value: a code per order or per customer.
- Error correction (Low, Medium, Quartile, High) sets how much of the code can be covered and still scan; higher makes a denser code. Medium is the default.
- Show the text under the code prints what it encodes. Code and Background colours default to black on white; keep the code dark on a light background so phones can scan it.
- A code holding a web address (
http://orhttps://) opens it when clicked in Dash view and for viewers; while editing, hold Ctrl (or Cmd) and click. - A code holds up to about 2,000 characters; past that the tile says it can't be drawn.
- Create a printable report from a dashboard turns it into a QR code box with the same content, unless one of its values is another dataset's field or a Summary Calculation.
Plan availability: Mini, Plus and Ultimate.
Fixed display limits#
Some visuals stop drawing past a fixed limit to stay readable and fast. You cannot change these, and the visual does not say that anything was left out (except the Filter visual).
| Visual | Fixed limit | What happens past it |
|---|---|---|
| Line chart, Area chart, Stacked area | 600 points | An evenly spaced sample is drawn, keeping the first and last points |
| Scatter plot | 2,000 dots | An evenly spaced sample of rows is drawn |
| KPI card sparkline | 120 points | The sparkline is sampled |
| Combo chart | 40 categories | The rest are left off |
| Heat map, Matrix (cross-tab) | 50 rows, 30 columns | The rest are left off |
| Matrix with several Values, or several Rows fields in the classic layout | 500 rows, 30 column values | The rest are left off; a note under the table says how many rows |
| Region map | 60 regions | The rest are left off |
| Treemap | 49 named tiles | The rest fold into Other |
| Pie chart | 48 named slices | The rest fold into Other |
| Box plot | 40 outlier dots per box | The rest are not drawn |
| Filter | 200 listed values | The rest are reached by search; picked values always show |
Plan limits summary#
| Visual type | Free | Mini | Plus | Ultimate |
|---|---|---|---|---|
| KPI card, Bar chart, Column chart, Pie chart, Grid, Filter, Text, Image, Shape, Button | Yes | Yes | Yes | Yes |
| Scorecard, Diverging bar, Line chart, Combo chart, Area chart, Stacked area, Stacked column, Stacked bar, Pareto chart, Waterfall, Scatter plot, Histogram, Box plot, Treemap, Funnel, Gauge, Bullet chart, Heat map, Calendar heat map, Region map, Gantt chart, Matrix, QR code | No | Yes | Yes | Yes |
| Grid editing (edit, add and delete rows) | No | Yes | Yes | Yes |
| Snapshot history setting on visuals (needs a snapshot dataset) | No | No | No | Yes |
Viewers of a shared report link see every visual type that is on the report.