
Docs › Build reports
Import from Power BI
A Power BI report comes across as a dashboard: its pages and visuals laid out as they were, its tables as datasets, its measures as Summary Calculations, its relationships as connections, and its filters, slicers, bookmarks, buttons and theme. This guide shows how to save a report from Power BI Desktop in a form that can be imported, how to import it, and what comes across and what doesn't.
What you need#
- A Power BI template (
.pbit) or a Power BI project (.pbip), saved from Power BI Desktop. The steps for a template are below. - A
.pbixcan't be imported. It holds the report's rows in Power BI's own compressed form, which nothing else can read. A template is the same report without those rows, so save the.pbixas a template and import that. Dropping a.pbixsays so and shows the steps. - The rows themselves, wherever the report read them: a database, a spreadsheet, or a dataset already in your workspace. A template carries no rows, so after the import you point each dataset at its data (see Choose where each dataset's rows come from).
Save your report as a template#
- Open the report in Power BI Desktop.
- Choose File › Save as. (On older versions of Power BI Desktop, choose File › Export › Power BI template, and skip the next step.)
- In Save as type, pick Power BI template files (*.pbit).
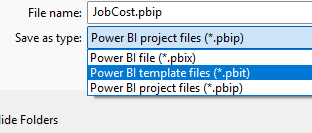
The Save as dialog in Power BI Desktop: pick Power BI template files (*.pbit). - Give it a name and choose Save. Power BI asks for a template description: leave it empty and choose OK.
The template is small, since it holds no rows. Your .pbix is unchanged.
Import it#
Upload the file#
- On the Reports page, open the folder the report should go in.
- Choose Upload report and pick the
.pbit(or a project's.zip). Or choose New report, then Dashboard, and under Start from pick From a Power BI report (.pbit or .pbip): drop the file on the box under it, click the box to browse, or choose Choose a project folder. Dropping a.pbiton New report's spreadsheet drop area switches to it too. Either way the file opens in the Upload report dialog. - The dialog reads the file in your browser and says what it is: "a Power BI report converted to a dashboard".
- Check the Report name. It starts as the file's name, numbered when the folder has a report with that name already.
- Under Datasets, choose where each dataset's rows come from (below).
- Read the Conversion notes, and choose Download notes to keep them as a Markdown file.
- Choose Upload report. The report is saved in the folder and opens in the builder.
Nothing is sent to the workspace until you choose Upload report.
Choose where each dataset's rows come from#
Each table of the Power BI model that the report uses becomes a dataset, named after the table, with the model's columns and types. Under its name the dialog says where Power BI read its rows, for example "From SQL Server srv01 / Sales / dbo.Orders" or "From the sheet Orders of C:\Data\Book.xlsx". For each dataset, pick one of:
- Use name in the workspace: a dataset already here with the same columns. One with the same name is picked for you. If the query in Power BI renamed columns (a source column
OrderTotalshown asAmount), a workspace dataset with the source's column names works too: the report readsOrderTotaland shows it asAmount. - Upload its n rows as a new dataset: offered when the rows were typed into Power BI (Enter data). They are in the template, so the dataset is made with them. When the plan keeps no more rows, it reads "A new dataset with its columns (this plan keeps no more rows)".
- Columns only: choose the file when the report opens: an empty dataset with the columns. The report asks for the spreadsheet each time it opens (see Supplying spreadsheets), or you can set the dataset up later.
When the report read a spreadsheet, upload that spreadsheet on the Datasets page first, under the table's name, and it is offered here. When it read a database, add the database as a data source and make a dataset of the same table (see Connect a database), or in the desktop app read it straight away (see Desktop app). The notes give the server, database and table, and the query Power BI ran.
A dataset made here gets the model's calculated columns as calculated fields and the model's number and date formats as its column formats. A dataset already in the workspace keeps its own settings; the notes list the calculated fields the model had, in case you want to add them.
The conversion notes#
The notes list everything the import couldn't bring across exactly, by kind:
- To set up: what you need to finish: datasets to bind to their rows, measures to write by hand as Summary Calculations (with their DAX), query steps the rows need, row access to set.
- Left out: what has no equivalent here (a decomposition tree, an inactive relationship), with where it was.
- Approximated: what came across close to, but not exactly as, Power BI had it (a map drawn as a region map, a filter on the same column folded into a Summary Calculation).
Each note names the page and visual (or the table and measure) it is about and the original DAX, query or setting. Download notes saves them all, with each dataset's source and its query, as <report name>.notes.md.
After the upload, the report keeps the notes. While you edit it, a strip under the builder's toolbar reads "Converted from Power BI (file): n things to set up, n notes on what changed". Show notes opens them, with Download notes. Dismiss removes them from the report once you've finished (save the report to keep that; it can be undone).
What comes across#
Pages and layout#
| In Power BI | Here |
|---|---|
| Pages, in order, and the page that was open | Pages, in the same order, opening on the same page |
| A hidden page | A hidden page |
| A visual's position and size | The same place on the 72-column grid. The page is scaled to the dashboard's width, keeping each visual's proportions, so a 1280 × 720 page fits a typical screen as it did |
| Visuals in a group | Placed where the group puts them; the group itself isn't kept |
| A textbox on a shape | A text visual on a shape visual, the shape behind |
| A visual's title | The visual's title; a hidden title stays hidden |
| A hidden visual (shown by a bookmark) | Left off the page, and kept in the bookmarks that show it |
Visuals#
| Power BI visual | Here |
|---|---|
| Clustered column chart | Column chart; with a Legend, a Stacked column with its series side by side |
| Stacked column chart, 100% stacked column chart | Stacked column (the 100% one as shares of 100%) |
| Clustered bar chart, stacked bar chart, 100% stacked bar chart | Bar chart or Stacked bar, the same way as the columns |
| Line chart | Line chart; a Legend becomes Split by |
| Area chart, stacked area chart | Area chart, Stacked area (an area chart with a Legend is stacked) |
| Line and stacked column chart, line and clustered column chart | Combo chart: Column y-axis values as columns, Line y-axis values as lines |
| Ribbon chart | Stacked column |
| Waterfall chart | Waterfall |
| Funnel | Funnel |
| Pie chart, donut chart | Pie chart (as a donut for the donut) |
| Treemap | Treemap |
| Scatter chart | Scatter plot: X, Y, Size and Legend; one dot per row |
| Map, filled map, shape map, Azure map | Region map: one hexagon per location, laid out in a grid rather than on geography |
| Gauge | Gauge, with its minimum, maximum and target read from fields |
| Card, card (new) | KPI card, one per value, side by side |
| KPI | KPI card with its trend and goal |
| Multi-row card | Scorecard (one category and one value) or Grid |
| Table | Grid; a table that totals values becomes a Matrix |
| Matrix | Matrix: its row levels (up to five), its column field and its values (up to six) |
| Slicer (list, tiles, dropdown, between, relative date, the new slicers) | Filter, as a list, buttons, dropdown, range, conditions or date hierarchy, keeping the values that were picked |
| Text box | Text: bold, italic, links, headings and alignment |
| Image | Image |
| Button | Button: go to a page, open a bookmark, or open a web address |
| Page navigator, bookmark navigator | One Button per page or bookmark, across the visual's width |
| Shapes | Shape: rectangle, rounded rectangle, oval or line |
| Gantt, Bullet chart, Box and Whisker, Histogram, Calendar (Microsoft's custom visuals) | Gantt chart, Bullet chart, Box plot, Histogram, Calendar heat map |
| Chiclet Slicer, Text Filter (Microsoft's custom visuals) | Filter |
Any other visual (a decomposition tree, key influencers, Q&A, an R or Python visual, an ArcGIS map, a Smart narrative, a custom visual not listed above) becomes a text visual in its place reading [Power BI: title: type], and the notes name it. Replace it with a visual from the Visuals pane, or delete it.
Importing is on Mini, Plus and Ultimate, and each of them offers all 33 visual types in the Visuals pane, so every visual the import made can be changed there (see Plan availability at a glance).
Fields and totals#
| In Power BI | Here |
|---|---|
| A column in a well | The same field in the matching well |
| Sum, Average, Count, Count (distinct), Minimum, Maximum | The same roll-up on the field |
| Median, Standard deviation, Variance | Average, with a note: write a Summary Calculation with MEDIAN or STDEV for the exact figure |
| A measure | The Summary Calculation it became (below) |
| A date's Year, Quarter, Month or Day (the date hierarchy) | The date at that grain on the axis |
| A hierarchy you built, in a matrix's Rows | Every level in the matrix's Rows, which drill down as in Power BI |
| A hierarchy you built, on a chart's axis | The first level's column; the notes list the other levels |
| A column of another table | Read through the connection when the two tables are related (see The Data pane, "Fields from connected datasets") |
| A visual sorted by its value | Sorted largest or smallest first |
| Renamed fields on a visual | The same labels |
| Number formats | The nearest format: currency, percent, whole number, decimals, millions |
Measures become Summary Calculations#
Each measure becomes a Summary Calculation with the same name, format and description, totalling the table its sums read. The formula is translated from DAX:
| DAX | Formula |
|---|---|
SUM(Sales[Amount]), AVERAGE, MIN, MAX, COUNT, COUNTA, DISTINCTCOUNT, MEDIAN | SUM([Amount]) and the same names (COUNTA as COUNT) |
COUNTROWS(Sales) | COUNTROWS() |
SUMX(Sales, Sales[Qty] * Sales[Price]), AVERAGEX, MINX, MAXX, COUNTX | SUM([Qty] * [Price]) and so on: every aggregate here works out its argument per row |
DIVIDE(a, b), DIVIDE(a, b, alt) | DIVIDE(a, b), IF(b = 0, alt, DIVIDE(a, b)) |
IF, SWITCH, SWITCH(TRUE(), ...), AND, OR, NOT, &&, ||, IN { } | IF, SWITCH, CASE, AND, OR, NOT, and OR of equals for IN |
BLANK(), ISBLANK, COALESCE | The same names |
ROUND, ABS, MOD, POWER, SQRT, ROUNDUP, ROUNDDOWN, INT | The same, or CEILING / FLOOR |
FORMAT, CONCATENATE, &, LEFT, RIGHT, MID, LEN, TRIM, UPPER, LOWER, SUBSTITUTE, SEARCH(...) > 0 | TEXT, CONCAT, &, the same names, REPLACE, CONTAINS |
YEAR, MONTH, DAY, TODAY, DATE, DATEDIFF, EOMONTH | The same names |
RELATED(Customers[Region]) | Customers[Region], read through the connection |
CALCULATE(SUM(Sales[Amount]), Sales[Region] = "West") | SUM(IF([Region] = "West", [Amount], 0)) (approximated: see the note below) |
DIVIDE(SUM(Sales[Amount]), CALCULATE(SUM(Sales[Amount]), ALL(Sales))) | PERCENTOFTOTAL(SUM([Amount])) / 100 |
RANKX(ALL(Sales[Region]), [Total Sales]) | RANK(SUM([Amount])) |
A measure built on other measures, [Gross] - [Cost] | Their formulas, written out |
VAR ... RETURN | The variables written out where they are used |
CALCULATE with a filter on a column narrows the rows, where Power BI replaces any filter on that column; the result is the same unless the visual or a slicer also filters that column. The notes mark each one.
What doesn't translate. Time intelligence (TOTALYTD, SAMEPERIODLASTYEAR, DATEADD, DATESYTD, PREVIOUSMONTH, PARALLELPERIOD), CALCULATE with FILTER, ALL on one column, KEEPFILTERS, REMOVEFILTERS, USERELATIONSHIP or TREATAS, and SELECTEDVALUE, HASONEVALUE, VALUES, EARLIER, LOOKUPVALUE, SUMMARIZE, ADDCOLUMNS, TOPN, USERNAME. Such a measure isn't made: the notes list it under To set up with its DAX, and the visuals that showed it leave it out until you add one. The common rewrites:
| Power BI | Write instead |
|---|---|
Year to date: TOTALYTD(SUM(Sales[Amount]), 'Date'[Date]) | RUNNINGTOTAL(SUM([Amount])) on a chart with the date on its axis by month and a filter on the year |
Last year: CALCULATE([Total Sales], SAMEPERIODLASTYEAR('Date'[Date])) | SUM(IF(YEAR([OrderDate]) = YEAR(TODAY()) - 1, [Amount], 0)), or PREVIOUS(SUM([Amount])) on a chart by year |
Change on the previous period: [Total Sales] - CALCULATE([Total Sales], PREVIOUSMONTH('Date'[Date])) | SUM([Amount]) - PREVIOUS(SUM([Amount])) on a chart by month |
A filtered total: CALCULATE([Total Sales], FILTER(Sales, Sales[Qty] > 10)) | SUM(IF([Qty] > 10, [Amount], 0)) |
The picked value: SELECTEDVALUE(Sales[Region]) | MIN([Region]), which is the value once a filter leaves one |
See Recipes for the common business calculations for more.
Calculated columns become calculated fields#
A DAX calculated column becomes a calculated field on its dataset, translated the same way. RELATED(Customers[Region]) reads the parent row through the connection, and SUMX(RELATEDTABLE(Lines), Lines[Qty]) totals the child rows (SUM(Lines[Qty])). A column that doesn't translate is listed in the notes with its DAX: add it as a calculated field yourself, or have the source return it.
Filters and slicers#
| In Power BI | Here |
|---|---|
| Filters on this visual | The visual's Show only rows where conditions |
| Filters on this page | The page's filters |
| Filters on all pages | Filters for all pages; a list of values is kept as a fixed parameter ("All pages (fixed)") |
| Basic filtering (a list of values), is not | Equals one of, or isn't one of, the values |
| Advanced filtering: comparisons, between, contains, is blank | The same conditions (starts with becomes contains) |
| Relative date filtering | In the last or next n days (weeks and months counted as 7 and 30 days) |
| Top N on the visual's own axis | The visual's limit on how many categories it shows, largest first |
| A slicer and the values picked on it | A Filter visual with the same values picked |
| Clicking a visual to filter the others | The same cross-filtering; a visual set not to filter the page keeps that setting |
A filter on a measure, a Top N on another field, and conditions on several fields joined with Or have no equivalent; the notes list them with their definition. See Filters and interactions.
Relationships become connections#
Each active relationship becomes a connection between the two datasets on the same fields, so cross-filtering, filters and fields of the related table reach across it as they did. A relationship that filters in both directions needs nothing extra. A many-to-many relationship is kept, but a cross-filter stops at it. An inactive relationship is left out.
Bookmarks and buttons#
Each bookmark becomes a bookmark of its page, with the filters, slicer picks and visuals the bookmark showed. A bookmark here holds the whole page, so one that changes only some visuals, or only the data or only what's shown, holds the page as the bookmark left it; the notes say which.
Buttons that go to a page, open a bookmark or open a web address do the same here. Back, Drill through, Q&A and Apply all slicers buttons are kept with no action.
Theme and colours#
| In Power BI | Here |
|---|---|
| A custom theme | A custom theme: its data colours for the series, its background, text and accent colours, and its good, bad and neutral colours |
| A built-in Power BI theme | The site theme; pick another in the Theme menu |
| A colour picked per value (East in blue) | The same colour for that value on every visual of that field |
| A visual's one series colour | The visual's first series colour |
| Legend shown or hidden, its position on a pie, data labels, gridlines, markers on a line | The same settings |
| Fonts of the theme and of text boxes | Kept where the font is one the builder has; otherwise the theme's |
Drill-through and tooltip pages#
A drill-through page stays a hidden drill-through page with the same drill-through fields, offered by every visual that shows one of them, as in Power BI. A tooltip page becomes a hidden page tooltip, and the visuals that used it show it when you point at them.
Where the rows come from#
A template has no rows. For each table, the import reads the Power Query (M) query to find where Power BI read them, and the notes and the dialog say so:
| The query read | The notes say |
|---|---|
| A table or view of a SQL Server database | The server, database and table, and the read to set up (the same table and columns) |
| A SQL statement on SQL Server | The statement, to save as a view or as a query text on a data source |
| A sheet or table of an Excel workbook, a CSV or a JSON file | The file and the sheet to upload |
| Rows typed into Power BI (Enter data) | Nothing to do: the rows come with the template |
| Another source (PostgreSQL, MySQL, Oracle, Snowflake, SharePoint, a web address, a folder, OData, a dataflow) | The source and its address, to set up as a data source where the app supports it |
Renamed columns in the query are matched (see above). Steps after reading that keep only some rows are listed as a filter to set on the data source. Steps that reshape the rows (adding a column, unpivoting, grouping, merging queries) can't be repeated here: the notes list each one with its M, so the rows can arrive already shaped, from a view or from the same query in the Query Workbench.
A report on a live connection (to a published Power BI dataset or Analysis Services) or in DirectQuery has no model of its own. It imports with each dataset's columns only, from the fields its visuals use, and its measures are listed to write by hand.
What doesn't come across#
| Power BI | What to do instead |
|---|---|
The rows (a .pbix's data) | Bind each dataset to its rows after the import |
| Drilling down a hierarchy on a chart | Put the levels in a matrix's Rows, which drills down them, or nest a visual under a grid or matrix (see Drill down) |
| Decomposition trees, key influencers, Q&A, Smart narrative, R and Python visuals, other custom visuals | Replace the placeholder with the nearest visual, or Ask FastPass |
| Small multiples, play axes, ribbon charts' ribbons, sparklines in tables | A visual per value, a date filter, a stacked column, a line chart beside the grid |
| Conditional formatting of chart colours by a measure | Conditional styling on a grid; colours per value on charts |
| Field parameters, what-if parameters | A Filter visual on a field |
| Visual backgrounds, borders, shadows and padding, and most of the Format pane's per-part styling | The theme and the visual's own options (see Visual options) |
| A fixed page size | Pages here are as wide as the screen; visuals keep their proportions |
Calculated tables (a table made by DAX, such as a date table from CALENDAR) | Not needed for dates: put the date on the axis at a grain. Otherwise upload the table's rows |
| Row-level security roles | Set row access on the dataset; the notes give each role's DAX filter |
| Query steps that reshape the rows | A view or a query that returns the rows already shaped |
| Mobile layouts, perspectives, personalised visuals, Copilot | Nothing to set: the builder lays pages out for every screen |
Desktop app#
The desktop app imports a Power BI report on your own computer, signed in or not, with no plan or account needed:
- Open… a
.pbitor a.pbipfrom the start page or the sidebar (the.pbipis read with theName.ReportandName.SemanticModelfolders beside it), or drop the file on the window. - Or in New report, choose Dashboard, then Start from From a Power BI report (.pbit or .pbip), and drop the file on the box under it, or click the box to browse.
The dashboard opens in the builder, and a Converted from Power BI window lists the datasets to fill and the conversion notes. Fill each dataset From a database…: when Power BI read a SQL Server table, the database dialog opens with the server, database and table already filled in, so you pick your connection and import. Or fill it from a spreadsheet. Save the report as an .ifpr, with the rows it read, and publish it to a workspace later if you like. See Converting a Power BI report.
Plan limits summary#
| Free | Mini | Plus | Ultimate | Desktop app | |
|---|---|---|---|---|---|
Import a .pbit or .pbip | No (nothing is saved) | Yes | Yes | Yes | Yes, without an account |
| Datasets the import makes | Columns only | Rows of typed-in (Enter data) tables kept, within 10 stored datasets; the rest columns only | The same, within 50 | Filled from a database or a spreadsheet, kept in the .ifpr | |
| Every visual type the import maps to | Yes | Yes | Yes | Yes |
The import counts as a new saved report against the plan's report limit (see Report limits), and needs edit access to the folder (owner or admin at the top level). Past the plan's stored datasets, a new dataset keeps its columns only, and the dialog says so.