
Docs › Build reports
Conditional styling in the grid
Conditional styling colours a grid's cells or whole rows when a rule holds, as conditional formatting does in Excel. For example, you can paint late orders amber, flag the five biggest deals, mark a price cell red when it is above average, or shade a margin column from red to green.
Rules are part of the grid visual. They are saved with the report, every change can be undone, and each grid has its own rules.
1. Adding a rule#
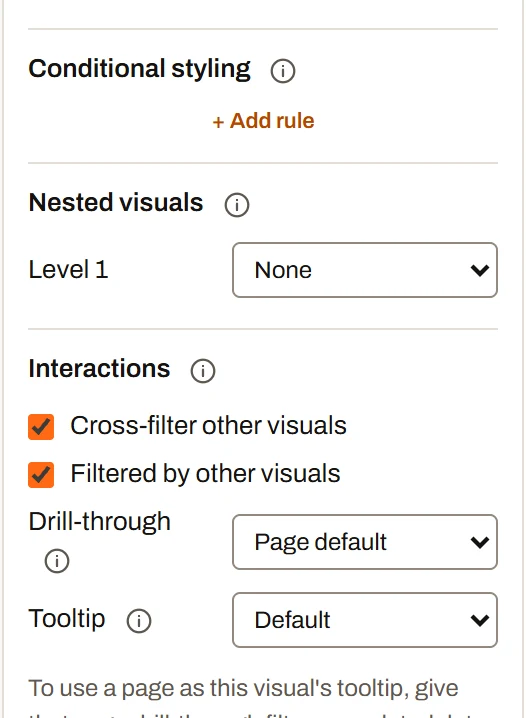
The Conditional styling section of a grid’s Visual pane.
- Select a grid on the canvas.
- In the settings pane on the right, find the Conditional styling section.
- Click + Add rule.
A new rule starts out colouring the whole row in the theme's Warning colour. It tests the grid's first field. Change any part of it:
| Setting | Choices |
|---|---|
| Colour | The whole row, or ⟨Column⟩ cells for any column the grid shows. |
| When | Condition: pick a field, a comparison and a value. Formula: write a test. Scale: shade a number column from low to high (see Scale rules). |
| Fill | Pick any colour with the colour box, or click a theme swatch. |
| Text | Auto (black or white, whichever reads better), or pick a colour. |
Each rule's header shows:
- A preview chip ("Aa") in the rule's colours.
- Its number.
- An On switch.
- ▲ / ▼ to change the order.
- × to delete the rule.
2. Condition rules#
A condition is a field, a comparison and a value. It works exactly like the visual's Show only rows where filter. Any column of the grid's dataset can be used, including calculated fields, even if the grid doesn't show that column.
The comparisons depend on the field's type:
| Field type | Comparisons | Value |
|---|---|---|
| Text | is, is not, contains, is not blank, is blank | For is and is not, you can list several values with commas (Late, Critical); any one of them matches. Matching ignores case. |
| Number | is more than, is at least, is less than, is at most, is, is not, is between, is not blank, is blank | A number: 100; for is between, a from and a to (either may be left empty). is also matches the same number written another way (250 and 250.0). |
| Date | is in the next (days), is in the last (days), is before today, is today or later, is after, is on or after, is before, is on or before, is, is not, is between, is not blank, is blank | A number of days (30), or a date as YYYY-MM-DD; is on a date keeps the whole day. |
- The value is saved when you press Enter or leave the box.
- A rule that still needs a value shows Enter a value and doesn't colour anything.
- Date comparisons look at the day only, and "today" moves on by itself, so is in the next 7 stays current.
3. Formula rules#
Switch When to Formula to write any test in the formula language. The cell or row is coloured when the formula is true. If the result is a number, any value other than 0 counts as true; a blank counts as false.
A rule's formula works out once per row, but it can also see every row the grid shows, and the rows of linked datasets. That makes comparisons possible that a simple condition can't do.
| Goal | Formula |
|---|---|
| Above the grid's average | [Sales] > AVERAGE([Sales]) |
| Top 5 by sales | RANK([Sales]) <= 5 |
| Bottom 3 | RANK([Sales], "asc") <= 3 |
| Over 10% of the grid's total | PERCENTOFTOTAL([Sales]) > 10 |
| Overdue and not finished | [Due] < TODAY() AND [Status] <> "Done" |
| Due in the next 14 days | DATEDIFF(TODAY(), [Due], "day") >= 0 AND DATEDIFF(TODAY(), [Due], "day") <= 14 |
| More than two standard deviations from the mean | ABS([Lead Time] - AVERAGE([Lead Time])) > 2 * STDEV([Lead Time]) |
| In the top 10% | [Score] >= PERCENTILE([Score], 0.9) |
| Two columns disagree | [Billed] <> [Quoted] |
| Order with no lines (child dataset) | COUNT(Lines[LineId]) = 0 |
| Lines don't add up to the order total | ABS(SUM(Lines[Qty] * Lines[Price]) - [Order Total]) > 0.01 |
| Customer on hold (parent dataset) | Customers[Status] = "On hold" |
| Over the customer's credit limit | [Balance] > Customers[Credit Limit] |
| Below a Summary Calculation | [Margin %] < [Target Margin %] where Target Margin % is a Summary Calculation |
| Value went down since the previous row | [Balance] < PREVIOUS([Balance], [Statement Date]) |
What a formula rule can see:
[Field]is this row's value.- Aggregates over the grid's own dataset, such as
AVERAGE([Sales])orMAX([Due]), read every row the grid shows. That means the rows left after the page filters, cross-filters, the grid's own Show only rows where conditions, and the latest snapshot. Rows scrolled out of view count. Rows filtered out don't. RANK,PERCENTOFTOTAL,RUNNINGTOTALandPREVIOUScompare this row with the grid's other rows. The grid's rows are taken in the order they arrive from the dataset, not the order you get by clicking a column header. ForRUNNINGTOTALandPREVIOUS, always give the order argument:PREVIOUS([Balance], [Statement Date]).- Parent lookups (
Customers[Region]) read the one matching row of a linked "one side" dataset. - Child aggregates (
SUM(Lines[Qty])) total the matching rows of a linked "many side" dataset. Linked rows aren't narrowed by page filters. - Summary Calculations of the grid's dataset can be named by
[Name]. They are worked out over every row the grid shows, so they give one value that is the same on every row.
As you type, the editor checks the formula and shows the result for the first row. A formula with a problem shows the message under the rule in red and doesn't colour anything until it is fixed.
Scale rules#
A scale rule shades one number column's cells on a gradient, like a colour scale in Excel or Power BI: the lowest value in the Low colour, the highest in the High colour, and everything between blended along the way.
- Colour lists only the grid's number columns: a scale has no whole-row form.
- Low and High each take a colour; type a number beside either to fix that end of the scale (values past it take the end colour). Left empty, the ends are the lowest and highest values the grid shows, so filtering the page rescales it.
- Middle adds a third colour halfway, for a red, white and green scale. None blends straight from low to high.
- The bar under the colours previews the gradient, and the rule's chip shows it too.
- Each cell's text is black or white, whichever reads better on its own shade, unless the rule picks a Text colour.
- A blank cell isn't shaded, so a later rule for the same column can still colour it.
A scale rule takes part in the order like any other: it is the first rule that holds on every cell of its column that has a number.
4. Which colour wins#
A grid can have many rules. Each cell's colour is decided like this:
- Rules are tried from top to bottom. For each target (the whole row, or one column), the first rule that holds wins. Later rules for the same target are skipped for that row.
- Different targets don't block each other. A row rule and a
Pricecells rule can both apply to the same row. - A column rule beats a row rule on its own cells. If the whole row is amber and the
Pricecells rule holds, thePricecell is thePricerule's colour and the rest of the row stays amber. - Rules that are switched off, have no fill colour, or have a problem are skipped.
Use ▲ / ▼ to put the more specific or more urgent rule first.
Worked example. A grid has three rules:
| # | Colour | When | Fill |
|---|---|---|---|
| 1 | The whole row | Status is Late | Critical (red) |
| 2 | The whole row | Status is Open | Warning (amber) |
| 3 | Price cells | [Price] > AVERAGE([Price]) | Good (green) |
| Row | Result |
|---|---|
| Status Late, Price below average | Whole row red. |
| Status Open, Price above average | Row amber, Price cell green. |
| Status Done, Price above average | Only the Price cell is green. |
| Status Done, Price below average | No colour. |
If rule 2 also tested Late, a late row would still be red. Rule 1 comes first, so rule 2 is skipped for that row.
5. Colours and readable text#
Fill#
- The colour box saves an exact colour such as
#fab219. Dragging inside the colour box counts as one change for Undo. - The theme swatches follow the theme instead of fixing a colour:
- Good, Warning, Serious, Critical: the status colours.
- Series 1–6: the chart colours.
When the report's theme changes, switches to dark mode, or the tile has its own palette, these rules repaint to match.
Text#
- When Text is on Auto, the text is black or white, whichever contrasts more with the fill. The choice uses the WCAG contrast formula, so a pale yellow fill gets black text and a dark navy fill gets white text. It is worked out again whenever the fill changes, including when a theme swatch changes with the theme.
- To force a text colour, pick one with the text colour box. Click Auto to go back to automatic.
6. How styling fits with the rest of the grid#
- Status pills and badges keep their own colours inside a coloured cell.
- Pinned (frozen) columns keep their colours when the grid scrolls sideways.
- Cross-filter selection. When you click a row to filter the rest of the page, the picked row keeps a visible outline over its rule colour, and the rows that aren't picked fade as usual.
- Sorting and scrolling don't change which rows are coloured, because the rules look at the data, not at the screen position.
- Filtering can change which rows are coloured when the rule compares across rows (
AVERAGE,RANKand so on), because the comparison is with the rows that are left. - Hidden columns. A rule can test a column the grid doesn't show. A rule that colours a column only shows when that column is on the grid.
- Nested grids (child rows opened under a row) aren't coloured by the parent grid's rules. Each nested grid level has its own Conditional styling list in its block under Nested visuals, with the same choices. A formula rule there compares a row with the other rows in the same nested grid (the rows under one parent row), so
[Sales] > AVERAGE([Sales])means above that group's average. - Editing cells. If the grid allows editing, a rule is checked again as soon as a value changes.
7. Tips#
- Start with a condition. Switch to a formula when you need to compare across rows, use linked data, or combine several tests (
AND/OR). - Put the narrow rule first. "Critical" before "Warning" before "Everything else".
- Use theme swatches for status-style colouring, so the grid matches the theme in light and dark mode.
- Leave Text on Auto unless you have a strong reason. It keeps every cell readable.
- Reuse logic. If the same test is used in many places, make it a calculated field (for example,
Is Overdue=[Due] < TODAY() AND ISBLANK([Closed])). Then a condition rule can checkIs OverdueisTRUE.