
Docs › Build reports
Visual options
Every visual has its own settings: which data it reads, how numbers are rolled up and formatted, its colours, fonts and the switches that only make sense for its type. This guide lists every setting in the visual pane, with its choices and defaults.
For what each visual type is for and which fields it needs, see Visual types. For moving and resizing visuals, pages and undo, see Report builder.
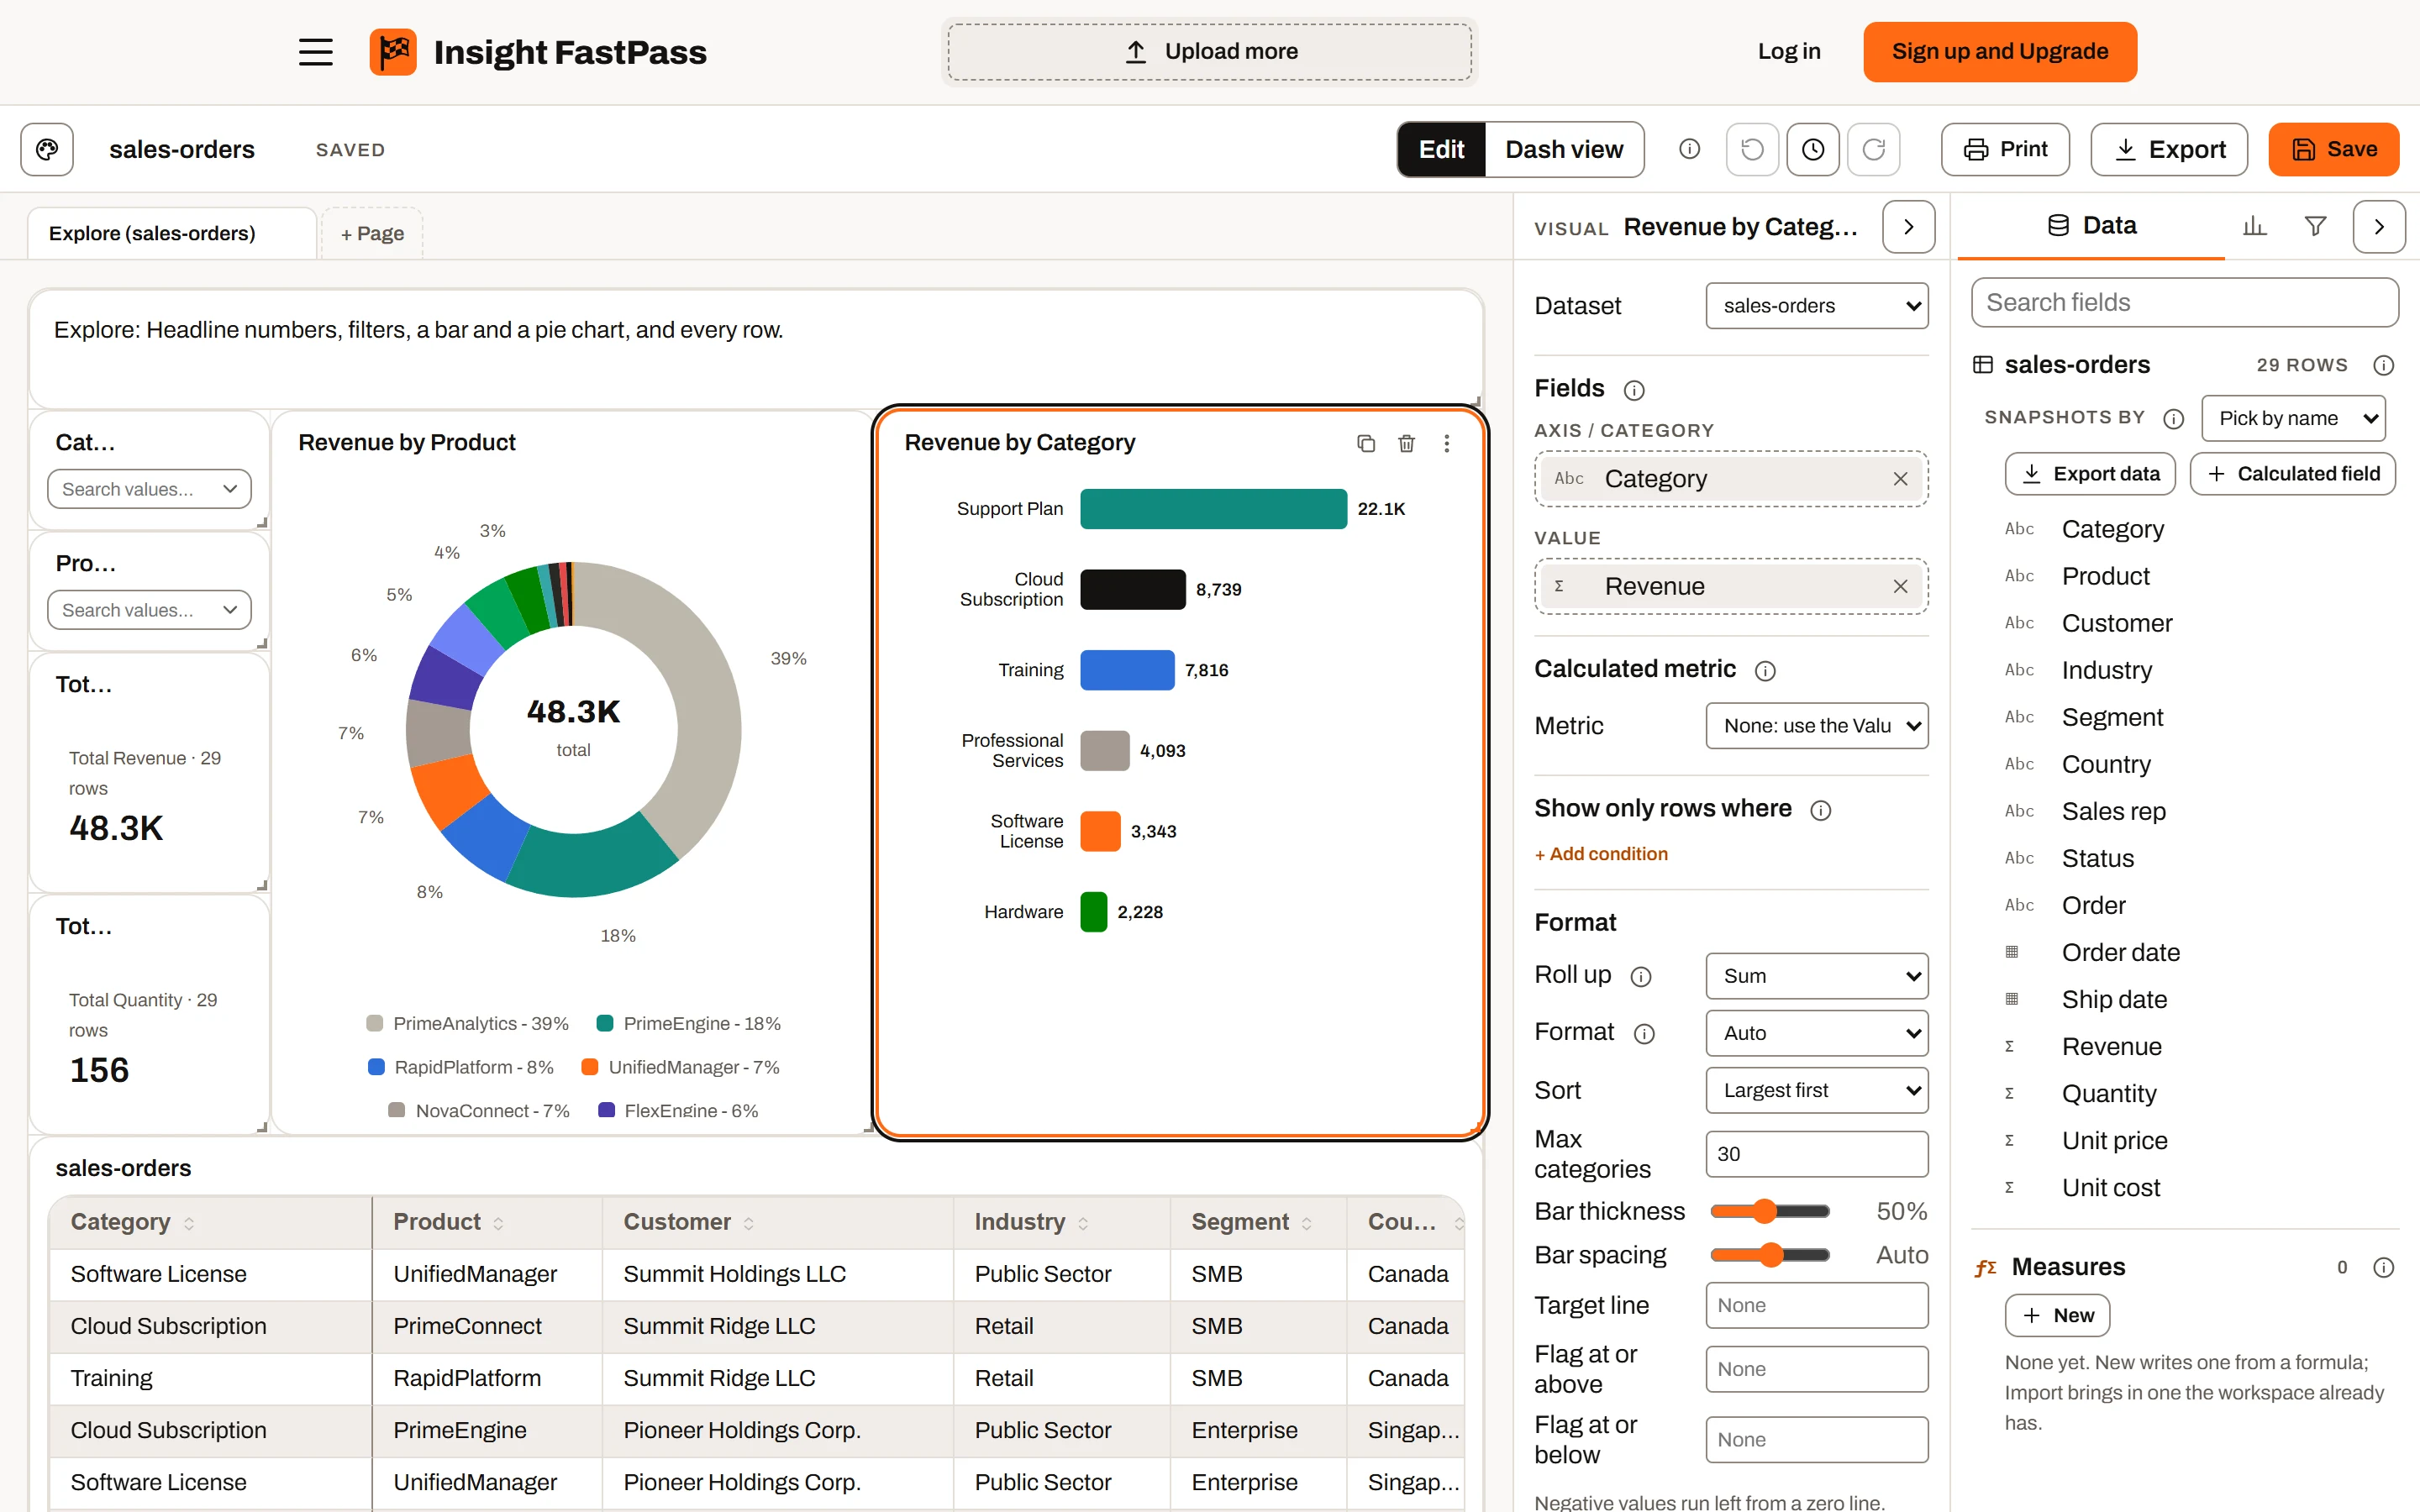
The report builder in Edit mode, on the sample sales orders.
Opening a visual's settings#
Click a visual on the page while you are editing a report. Its settings open in the Visual pane on the right of the canvas, headed with the visual's title (or its type, if it has no title).
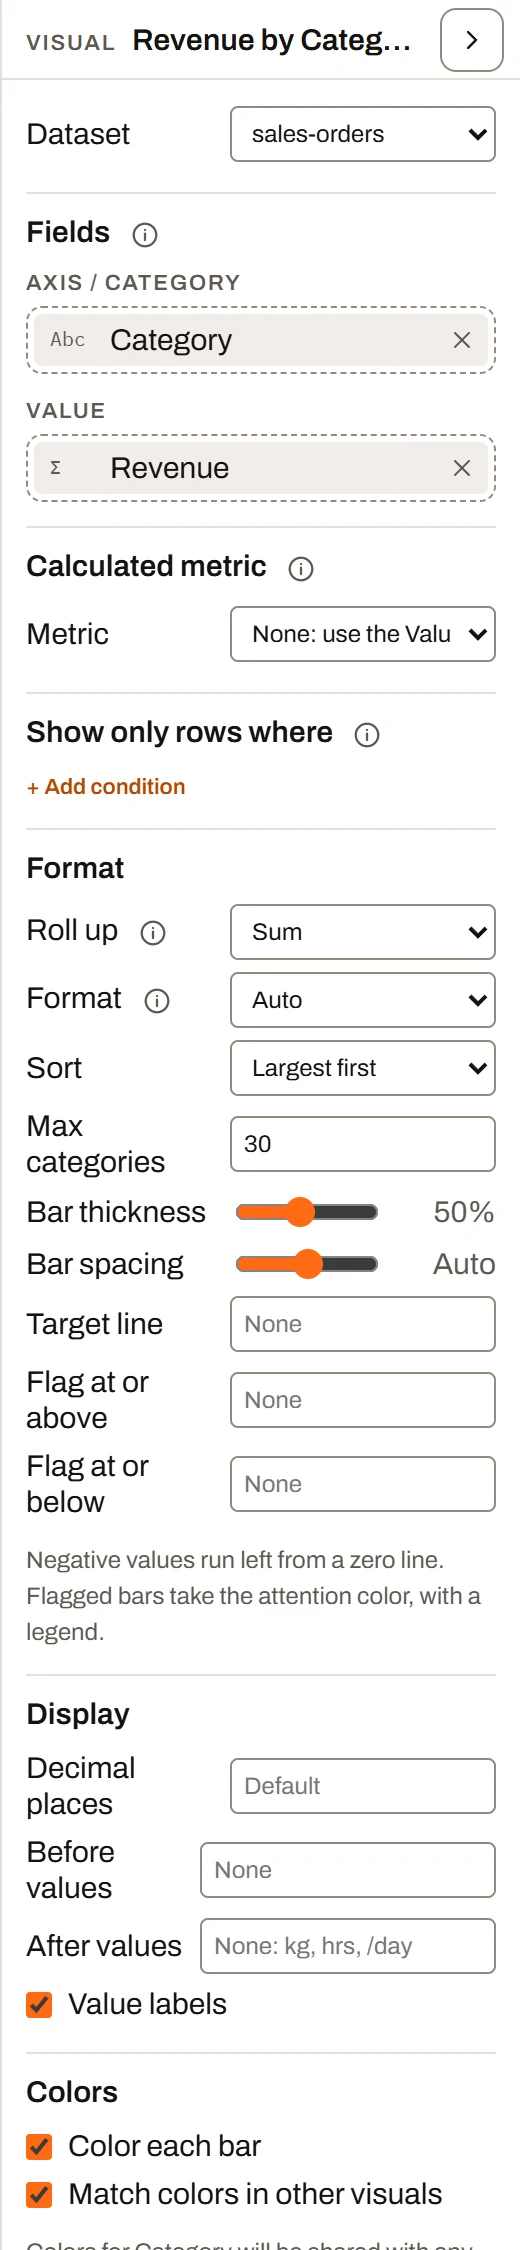
The Visual pane, showing a bar chart’s settings.
- With nothing selected, the pane says "Select a visual on the page to set its fields and format."
- With several visuals selected, the pane explains that you can move, copy, paste or delete them together, and that you click one on its own to set its fields and format.
- Drag the pane's left edge to make it wider or narrower (200 to 520 pixels). Use the arrow button at its top to fold it down to a thin strip, and again to open it.
- While the toolbar's history (clock) button is on, the pane shows the report's history instead.
- Search settings, pinned at the top of the pane, narrows it to the settings whose name holds every word you type (for example
legendortooltip width). Typing a section's name, such asinteractionsorfonts, shows that whole section. The search stays as you select other visuals; clear it to see every setting again. - A setting with more than one control, such as Tooltip width (a number and its unit), a colour and its Default, a slider and its value, or a row of buttons like Align, puts its controls on their own line under its name, so they stay visible however narrow the pane is.
Every change you make in the pane takes effect immediately and is one undo step. Press Ctrl+Z to undo and Ctrl+Y to redo. Dragging a colour picker or a slider counts as one step for the whole drag.
The pane is shown in edit mode only.
Title and header#
Titles are set on the visual itself, not in the pane.
- Automatic titles. A new visual is titled from its fields, for example "Revenue by Region", "Count by Status" or "Total Revenue". The title updates as you change fields, until you type your own.
- Rename. Double-click the title on the visual (or choose Rename from its More options menu) and type. Press Enter or click away to finish. Your title then stays fixed when fields change.
- Hide Header / Show Header. In the More options menu (the three dots on the visual's header). A hidden header removes the title bar from the page; while you are editing, the header floats over the visual when you hover so you can still move it and reach its tools. Renaming a visual with a hidden header shows the header again.
- The header's tools, visible while editing, are Duplicate, Delete and More options (Rename, Copy (Ctrl+C), Paste (Ctrl+V), Hide Header or Show Header).
- When a visual's Filtered by other visuals setting is off and someone has clicked a mark in another visual, the header shows an Ignores selection note.
There is no subtitle setting. To add a line of explanation under a visual, place a Text visual next to it.
Size and position are set by dragging and resizing on the canvas, not in the pane. See Report builder.
The sections of the pane#
The pane shows only the sections that apply to the selected visual, in this order:
- Dataset
- Fields
- Calculated metric (KPI card, Bar, Column, Line and Gauge)
- History (datasets that stack snapshots)
- Show only rows where
- Format (the type's own settings)
- Display
- Colors
- Interactions
- Fonts
Dataset#
Dataset picks which dataset the visual reads. It is shown on every visual except Text.
Switching dataset keeps any fields the new dataset also has (for example two months of the same spreadsheet) and clears the rest. A grid left with no columns shows every column of the new dataset.
Fields#
The Fields section holds the visual's field wells (described per type in Visual types). Its info tip reads: "Drag columns from the Data tab into these wells. Renaming a field here changes only this visual; an Alias in the Data tab renames it everywhere."
- Add a field: drag a column from the Data tab into a well. A single-field well swaps its field; a multi-field well inserts it where you drop it.
- Reorder: in a multi-field well, drag the chips into a new order.
- Remove: click the x on a chip. A grid always keeps at least one column ("Keep at least one field").
- Rename on this visual: double-click a chip's name, or click its pencil, type a label and press Enter (Escape cancels; Tab moves on to the next chip). The label is used in this visual's axes, legend, tooltips and automatic title. When the label differs from the dataset's column name, the chip shows "Label (Column name)". To rename a column everywhere, give it an alias in the Data tab instead (see Datasets).
Summary Calculations can be dropped into number wells like any column. They are covered in Formulas.
Calculated metric#
Available on: KPI card, Bar chart, Column chart, Line chart and Gauge.
Info tip: "A number built from a formula over several columns, like a ratio, a rate or a margin, instead of rolling up one column. Pick None to use the Value field."
Metric offers None: use the Value field (the default) and about 40 ready-made business metrics grouped by area: Sales, Cost, Finance, Purchasing and delivery, Operations, Quality, Workforce, Safety, Inventory, Change management, Equipment and Executive. Examples are Win rate %, Gross margin %, Days sales outstanding, On-time delivery %, OTIF %, Scrap rate %, TRIR and Revenue vs target %.
When you pick a metric:
- The pane shows its formula in words, then one box per column it needs (for example the revenue column and the cost column). Optional inputs can be left as (none).
- Some metrics count rows with certain values (for example the statuses that count as "Won"). Type those values, comma separated; the pane shows sample values from that column underneath.
- Pick fields again re-runs the automatic column matching.
- Until every column is picked and each list has at least one value, the pane says "Pick every column and at least one value in each list to draw this metric." and the visual says "Pick a metric's columns and values (Calculated metric) in the Data pane".
- The visual's value wells and Roll up are hidden while a metric is active, because the metric has its own formula. A line chart's Target line well and a column chart's More values well are hidden too.
- With Format on Auto, the metric's own format is used (percent for a rate, currency for a money figure). The automatic title becomes the metric's name, for example "Win rate % by Region".
- Ratios are worked out as a ratio of totals over the rows in view (sum of A divided by sum of B), not an average of row-by-row ratios.
History#
Shown when: the visual's dataset stacks several snapshots of the same data (see Snapshots and versions). Not shown on Filter or Text visuals.
Snapshots has three choices:
| Choice | What the visual reads |
|---|---|
| Auto (default) | Every snapshot when the snapshot date is on the visual's axis (a trend), otherwise only the latest |
| Latest only | The newest snapshot, or the one a page filter on the snapshot date picks |
| Every snapshot | All of them. Put the snapshot date on the axis so each one is its own point, otherwise totals are counted once per snapshot. |
A sparkline along the snapshot date always reads every snapshot, so a KPI card can show its history.
Plan availability: snapshot datasets are part of Ultimate.
Show only rows where#
Shown on: every visual except Filter and Text. Info tip: "A filter for this visual alone. Page filters and Filter visuals still apply on top."
Click + Add condition, pick a field, a comparison and (where needed) a value. Every condition has to hold. Remove one with its x.
| Field type | Comparisons |
|---|---|
| Text | is, is not (both take a comma-separated list, for example "Late, Critical"), contains, is not blank, is blank |
| Number | is more than, is at least, is less than, is at most, is, is not, is not blank, is blank |
| Date | is in the next N days, is in the last N days, is before today, is today or later, is after (a date), is before (a date), is not blank, is blank |
Days count from the start of today, so "is in the next 14 days" moves forward each day.
For page-wide filtering, see Filters and interactions.
Format#
The Format heading appears on every visual with field wells. Under it come the two axis settings below (when they apply), then the type's own settings (see Settings for each visual type).
Number ranges#
Shown when: a number column is on the axis of a Bar, Diverging bar, Column, Line, Pie, Stacked area, Stacked column, Stacked bar, Pareto, Scorecard, Box plot or Heat map (rows or columns). Info tip: "Groups a number column into buckets so it can be used as an axis. Auto picks 5 to 10 even ranges."
Choices: Every value (default, no grouping), Auto (5 to 10 ranges), or 5 ranges to 10 ranges.
Group dates by#
Shown when: a date or month column is on the axis of a Bar, Diverging bar, Column, Line, Combo, Area, Stacked area, Stacked column, Stacked bar, Waterfall, Heat map, Box plot or Matrix, or on a KPI card's or Scorecard's Sparkline along. Info tip: "Rolls dates up to the day, week, month, quarter or year before grouping."
Choices: Every date (default), Day, Week (weeks start on Monday), Month, Quarter, Year. Labels are shown in Visual types. The snapshot date of a snapshot dataset is never grouped.
Display#
Shown on: every visual that draws numbers or has one of the switches below.
| Setting | Choices and default | What it does |
|---|---|---|
| Decimal places | 0 to 6; empty (Default) | Fixes the decimals on the visual's values. Empty keeps the visual's own: 1 on most visuals, 0 on the Funnel, Gauge and Heat map. Not on Gantt, Grid, Filter, Text or Histogram. |
| Before values | Text; empty | Text placed before every value, for a unit the number formats do not cover |
| After values | Text; empty (placeholder "None: kg, hrs, /day") | Text placed after every value, for example "kg" or " hrs" |
| Switches | On by default | See the table below |
Before values and After values are not offered on the Combo chart, Pareto chart and Scatter plot (they have two axes that would share one unit), nor where Decimal places is not offered. On a stacked chart shown as percent of total, they are not drawn.
When you set Decimal places and Format is Auto, the pane notes "With decimal places set, the Auto format writes numbers in full rather than shortening them." (Auto otherwise shows values under 10,000 as whole numbers.)
The Display switches appear only where the visual draws the piece they turn off:
| Switch | Visuals | Default |
|---|---|---|
| Value labels | Bar, Diverging bar, Waterfall | On |
| End labels / End label | Line / Area | On |
| Total labels | Stacked column, Stacked bar | On (hidden while showing percent of total) |
| Percent labels | Pie | On |
| Values in regions | Region map | On |
| Dots on the line | Line, Combo, Pareto | On |
| Legend | Diverging bar, Line, Pie, Combo, Pareto, Stacked area, Stacked column, Stacked bar, Waterfall, Bullet; Column only with More values; Scatter only with Color by | On |
| Band legend | Gauge | On |
| Grid lines | Column, Line, Combo, Pareto, Area, Stacked area, Stacked column, Waterfall, Scatter, Histogram, Box plot | On (off on the Histogram) |
| Color scale | Heat map, Region map, Calendar heat map | On |
Colors#
The Colors section appears on visuals that use colour to encode something. It can contain three kinds of control.
Color each bar / column / box#
Shown on: Bar chart and Bullet chart (Color each bar), Column chart with one value and Pareto chart (Color each column), Box plot with a category (Color each box). On by default.
On, each mark gets its own colour by category. Off, every mark is drawn in the one main colour. On a Column chart, turning it on also turns off Shade light to dark along the axis, and that shading switches it off while it is on.
Colours by value#
Shown when: the visual colours its marks by the values of a field:
| Visual | Coloured by |
|---|---|
| Bar, Column, Pareto, Bullet, Box plot (with Color each on) | The category field |
| Pie, Treemap | The slices or tiles field |
| Stacked area, Stacked column, Stacked bar | The Stack by field (not on a Stacked bar with Shade stacks light to dark) |
| Scatter plot | The Color by field |
| Gantt chart | The Owner field |
The section then shows:
- Match colors in other visuals (on by default). On, the colours you pick for a value (say "North" in blue) are shared by every visual on the same dataset that colours by the same field, across all pages, so "North" is the same colour everywhere. A note says how many other visuals share them. Off, this visual keeps its own colours ("These colors are this visual's own."); turning it off copies the shared colours as a starting point.
- A colour swatch for each value, in the order the visual draws them. Click a swatch to pick a colour. A picked value shows a reset arrow ("Back to the palette color"), and Reset all returns every value to its palette colour.
Values you have not picked a colour for take the next colour from the palette, in a fixed order based on the whole dataset, so filtering the page does not reshuffle colours. The palette has 8 base colours; past those, lighter and darker variants are used (48 distinct colours in all).
Palette colours#
Other colour jobs use palette swatches. Each swatch writes a colour for this visual only; Reset returns them all to the report theme's colours.
| Swatch group | Swatch labels | Visuals |
|---|---|---|
| Series | Main color (one series), or one per series named after it (a measure, a stack) or Series 1, Series 2... | KPI card and Scorecard (sparkline accent), Column, Line, Combo, Pareto (column and Cumulative % line), Area, Stacked area / column without Stack by, Histogram, Box plot, Funnel, Bullet, Bar (when Color each bar is off) |
| Sequential | Intensity (the dark end of a light-to-dark ramp; the lighter steps are worked out from it) | Heat map, Calendar heat map, Region map, Matrix (with Shade by value), Stacked bar (with Shade stacks light to dark) |
| Diverging | Increase, Decrease | Waterfall, Diverging bar |
| Status | Good, Fair, Poor | Gauge bands, Gantt status colours (with a Status field), Bar chart flags (with Flag at or above or Flag at or below set) |
When a visual colours by value, its series colours are edited in the value swatches instead of here.
Interactions#
Shown on: every visual except Text. Info tip: "Clicking a bar, slice, cell or row selects it and filters the page's other visuals as if it had been picked in a Filter visual. Ctrl or Cmd + click picks more than one; click empty space or press Esc to clear. Selections reach other datasets through their connections, from the one side to the many side."
| Setting | Default | What it does |
|---|---|---|
| Cross-filter other visuals | On | Clicking a mark in this visual filters the rest of the page. Not offered on the KPI card, Scorecard, Gauge, Filter or Text, which have nothing to click. |
| Filtered by other visuals | On | Selections made in other visuals filter this one. Off, this visual ignores them (page filters and Filter visuals still apply). |
| Drill-through | Page default | Whether a right-click on a mark offers Drill to the drill-through pages on related data: Page default follows each page's Offer from visuals by default, Offer always does, Don't offer never does. Shown where Cross-filter other visuals is. |
| Tooltip | Default | Default is the chart's own tooltip. A page shows that page's tooltip area instead, filtered to the mark under the pointer. Pages are listed when they have a tooltip area and drill-through filters on related data. |
| Tooltip width | 30% of page | With a tooltip page picked: how wide it draws, in % of the page's width or in pixels. |
How selections combine, drill-through and page tooltips are covered in Filters and interactions.
Fonts#
Shown on: every visual. At the top, All sizes (% of default) sets every size at once; under it, each piece the visual draws gets one row with a font box, a size box and a reset (x) button.
| Visual | Pieces |
|---|---|
| All | Title (14 px) |
| KPI card, Scorecard | Value (21), Caption (11) |
| Bar | Axis labels (11), Data labels (10.5), Legend (11, only with flags set) |
| Diverging bar, Stacked bar | Axis labels (11), Data labels (10.5), Legend (11) |
| Column | Axis labels (9.5), Data labels (10.5), Legend (11, only with More values) |
| Line | Axis labels (9.5), Data labels (10.5), Legend (11, with more than one line or a target) |
| Area | Axis labels (9.5), Data labels (10.5) |
| Stacked area, Pareto, Combo | Axis labels (9.5), Legend (11) |
| Waterfall, Stacked column | Axis labels (9.5), Data labels (10.5), Legend (11) |
| Scatter | Axis labels (9.5), Legend (11, with Color by) |
| Histogram | Axis labels (9.5) |
| Box plot | Axis labels (11) |
| Bullet | Category labels (11), Legend (11) |
| Pie | Percent labels (9.5), Center total (17, donut only), Legend (11) |
| Gauge | Value (34), Caption (13), Bands (11) |
| Treemap | Tile labels (11.5) |
| Funnel | Stage labels (11.5) |
| Region map | Region labels (11), Scale (10.5) |
| Calendar heat map | Axis labels (9.5), Day values (7.5), Scale (10.5) |
| Heat map | Column headers (11.5), Rows and cells (12), Scale (10.5) |
| Matrix | Column headers (11.5), Cells (12) |
| Grid | Column headers, Cells (11.5, 12.5 or 13.8 for grid size S, M or L) |
| Gantt | Header and timeline (12), Task rows (13.5), Owner icons (10.5, with an Owner field: the initials, and the circle grows or shrinks with them), Status badges (10.5: the status badge and the progress figure under it; the space between them, the progress bar and the column's width follow it), Bar labels (12: the bars' height follows it), Legend (12.5, with a Status field). Rows grow or shrink to fit the bars, owner circles, status column and task names at their sizes |
| Filter | Items (11) |
| Text | Text (22 Heading, 16 Subheading, 14 Body) |
- Font: type any font name or pick from the list. The list offers web fonts (loaded from Google Fonts when picked): IBM Plex Sans, IBM Plex Mono, Inter, Roboto, Roboto Mono, Open Sans, Lato, Montserrat, Source Sans 3, Nunito Sans, Work Sans, Poppins, Merriweather, JetBrains Mono and Space Grotesk; and fonts installed with Windows or macOS: Arial, Helvetica, Verdana, Tahoma, Trebuchet MS, Segoe UI, Calibri, Candara, Georgia, Cambria, Times New Roman, Palatino Linotype, Garamond, Century Gothic, Franklin Gothic Medium, Lucida Sans, Rockwell, Impact, Courier New and Consolas. If an installed font you name is not on your device, the row says "Not installed on this device" (readers without that font see a fallback). Empty keeps the default font.
- All sizes (% of default): a percentage from 25 to 200, in steps of 5 (empty shows 100). It sets every piece's size box to that share of its default, so 80 turns a 12 px header into 9.6 px and a 14 px title into 11.2 px (never below 6). You can still change any one size afterwards. Empty or 100 puts every size back to its default; fonts are not changed.
- Size: in pixels, from 6 to 96, in steps of 0.5. The box shows the default size as a grey placeholder, and the up and down arrows step from that default (12 goes to 12.5 or 11.5). Smaller companion text (such as tick labels under category labels) scales with it.
- Reset: the x on a row returns that piece to its default font and size. Reset fonts (shown once anything is changed) resets every piece and All sizes.
Common settings reference#
These settings appear on many visual types under Format.
Roll up#
Info tip: "How the rows in each group become one number. Sum adds them, Count of rows counts them, Average, Minimum and Maximum do what they say."
Choices: Sum (default), Count of rows, Average, Minimum, Maximum. The Pareto chart offers only Sum and Count of rows. Hidden while a calculated metric is active. Not on the Scatter plot, Histogram, Box plot, Gantt, Grid, Filter or Text.
Format (number format)#
Info tip: "Auto shortens big numbers (1.2K, 3.4M) and picks decimals to fit. Choose a format to fix it."
| Format | 1234567.8 shows as | Notes |
|---|---|---|
| Auto (default) | 1.2M | 10,000 and above are shortened with K, M or B; smaller values show as whole numbers with separators (3.4 shows as 3) |
| Number | 1,234,567.8 | Separators and the visual's decimals |
| Whole number | 1,234,568 | Rounded, no decimals |
| Compact (1.2K) | 1.2M | K, M, B; small values keep decimals only under 10 |
| Currency | $1,234,567.8 | Dollar sign; a minus goes before it (-$19K) |
| Currency, compact | $1.2M | |
| Currency, millions | $1.2 M | Always in millions, even for billions ("$1,240 M"); zero shows as $0 |
| Percent | 1,234,567.8% | Adds a % sign to the number as it is |
| Percent, whole | 1234568% | Rounded, with a % sign |
On the KPI card, Bar, Column, Line and Gauge, leaving Format on Auto uses a calculated metric's own format, or the format of a Summary Calculation in the first value well.
Sort#
Choices on the Bar chart, Scorecard, Diverging bar and Bullet chart (and Sort by median on the Box plot):
| Choice | Order |
|---|---|
| Largest first | By value, largest first |
| Smallest first | By value, smallest first |
| Sheet order | The order the categories come from the data (dates and grouped values in date order) |
| Sheet order, reversed | That order, last first |
Max categories, Max cards and similar limits apply after sorting.
X axis labels#
Shown on: Column, Line, Combo, Area, Stacked area, Stacked column, Pareto and Waterfall. Choices: Horizontal, Diagonal (default), Vertical.
Under it, Scroll sideways when crowded (off by default) gives every category the same room along the axis. When they need more than the visual is wide, the visual scrolls left and right instead of squeezing them together, and the value axis stays in view. It never scrolls up and down.
Target line#
Shown on: Bar and Column, and Line when it has no Target line field.
- Target line: a number; empty (None) by default. Draws a dashed line at that value.
- Target label: shown once a target is set; placeholder Target. Names the line in the legend and tooltip. On a Line chart with a Target line field, only Target label is shown and renames that field's line.
Dashed#
Shown on: Line (each value field) and Combo (each line value), when Roll up is not Count of rows. Info tip: "Draws the series as a dashed line, for targets or forecasts." Tick each series to dash.
Show as percent of total#
Shown on: Stacked area, Stacked column and Stacked bar. Off by default. Draws each column, bar or point as shares of 100%, so the mix reads whatever the totals are. On the stacked column and bar, the values and axis switch to whole percents, total labels are hidden and (stacked bar) sorting by total is turned off.
Settings for each visual type#
Settings already described above (Roll up, Format, Sort, X axis labels, Target line, Dashed, Show as percent of total, Number ranges, Group dates by) are listed by name only.
KPI card#
| Setting | Choices and default | What it does |
|---|---|---|
| Roll up, Format | See above | |
| Caption | Text; empty (Automatic) | Replaces the automatic line above the number, for example "Total Revenue · 1,240 rows" |
| Background | Colour; Default (the theme's tile colour) | The card's fill. Click Default to go back. |
| Text | Colour; Auto | The card's text. Auto picks black or white, whichever reads better on the background ("Auto text turns black or white, whichever reads better on the background."). |
| Show change vs previous point | Off | Shows the change from the sparkline's previous point to its last, for example "+4% vs previous month" (in points, "+6 pts", for a percent value). Needs a Sparkline along field; without one the pane says "The change is read from the sparkline: add a date to Sparkline along." |
| Higher is better | On (shown with Show change) | Off colours a rise red and a fall green, for costs, days late or incidents. A calculated metric sets its own direction unless you change it. |
| Goal | Number; empty (None) | Shows the value as a percent-of-goal meter ("1.2M of 1.5M target") in place of the change. With a field in the Goal well this box is hidden: the field is the goal, rolled up over the same rows as the value. |
Scorecard#
| Setting | Choices and default | What it does |
|---|---|---|
| Roll up, Format, Sort | Sort default Largest first | |
| Max cards | Whole number; 8 | Cards drawn; 0 draws one per category |
| Show change vs previous point | Off (shown once Sparkline along has a field) | Each card shows its change from its sparkline's previous point |
| Higher is better | On (shown with Show change) | As on the KPI card |
Bar chart#
| Setting | Choices and default | What it does |
|---|---|---|
| Roll up, Format, Sort | Sort default Largest first | |
| Max categories | Whole number; 30 | Bars drawn after sorting; 0 keeps every category |
| Bar thickness | Slider, 10% to 100% in steps of 5; 50% | How much of each row a bar fills. 100% makes bars touch. |
| Bar spacing | Slider, 0 to 40 px; Auto | Auto stretches the rows to fill the tile. Set, each row is the bar plus this gap, so bars stay a fixed size. Click the pixel value to go back to Auto. |
| Target line, Target label | See above | |
| Flag at or above | Number; empty (None) | Bars at or above this value take the attention colour, with a legend |
| Flag at or below | Number; empty (None) | Bars at or below this value take the attention colour |
The pane notes: "Negative values run left from a zero line. Flagged bars take the attention color, with a legend." Bars are coloured by category unless Color each bar is off.
Diverging bar#
| Setting | Choices and default | What it does |
|---|---|---|
| Roll up, Format | ||
| Center value | Number; 0 | The fixed centre, used when there is no Center field or when counting rows |
| Right side | Text; Above | Name for bars running right, in the legend and tooltip |
| Left side | Text; Below | Name for bars running left |
| Bad side | Left or Right; Right | Which side is coloured as the unwanted direction |
| Sort | Largest first | |
| Max categories | Whole number; 20 | 0 keeps every category |
The pane notes: "Each bar is Value minus Center: a Center field rolled up the same way, or the Center value when there is none."
Column chart#
| Setting | Choices and default | What it does |
|---|---|---|
| Roll up, Format | ||
| Value labels | None, First and last (default), All | Which columns show their value |
| Max categories | Whole number; 30 | Columns drawn, keeping the first ones in axis order; 0 keeps all |
| Shade light to dark along the axis | Off | Shades columns from light to dark along the axis, for ordered buckets such as aging bands. Overrides Color each column while on. |
| Target line, Target label | See above | |
| X axis labels | Diagonal |
With More values filled, the pane notes: "More values draws a column for each field side by side, in its own color. Keep them in one unit: they share the axis."
Line chart#
| Setting | Choices and default | What it does |
|---|---|---|
| Roll up, Format | ||
| Start axis at zero | Off | Starts the value axis at zero instead of near the lowest value |
| Named lines | Whole number; 8 (with Split by only) | How many of the Split by field's values get a line of their own, largest first; the rest are added together as one Other line. Empty or 0 draws them all (up to 24). With Split by, Dashed and the target line are hidden. |
| Dashed | Per value field; none | See above |
| Target line, Target label | See above | A fixed target, or only the label when a Target line field is set |
| X axis labels | Diagonal |
Pie chart#
| Setting | Choices and default | What it does |
|---|---|---|
| Roll up, Format | ||
| Donut | On | Draws a ring instead of a full pie |
| Total in the middle | On (donut only) | Shows the total in the donut's centre |
| Named slices | Whole number; empty (All) | How many slices get their own name before the rest fold into Other. Empty or 0 draws them all (up to 48). |
| Legend | Left (default), Right, Top, Bottom | Where the legend sits. Hide it with the Legend switch under Display. |
Combo chart#
| Setting | Choices and default | What it does |
|---|---|---|
| Roll up, Format | Format applies to the column values (left axis) | |
| Line format | Same choices as Format; Auto | Format of the line values (right axis) |
| Dashed | Per line value; none | |
| X axis labels | Diagonal |
Area chart#
Roll up, Format and X axis labels (default Diagonal).
Stacked area#
Roll up, Format, Show as percent of total, X axis labels and, with Stack by set, Named stacks (see Stacked column).
Stacked column#
| Setting | Choices and default | What it does |
|---|---|---|
| Layout | Stacked (default), Side by side | Side by side draws the parts as columns next to each other, from the axis, each with its value on top while there is room |
| Roll up, Format | ||
| Max categories | Whole number; 30 | Columns along the axis; 0 keeps every category |
| Show as percent of total | Off (stacked only) | |
| X axis labels | Diagonal | |
| Named stacks | Whole number; 8 (with Stack by only) | How many of the Stack by field's values get a segment of their own, largest first. The rest are added together as one grey Other segment on top, so each column's total stays whole; clicking it filters to the values it holds. 0 names them all (up to 48). |
Stacked bar#
| Setting | Choices and default | What it does |
|---|---|---|
| Roll up, Format | ||
| Max categories | Whole number; 12 | 0 keeps every category |
| Largest total first | On | Off keeps the axis field's order |
| Shade stacks light to dark (for ordered buckets) | Off | Colours segments along one light-to-dark ramp instead of a colour per value |
| Layout | Stacked (default), Side by side | Side by side lays the parts one under another in each bar's band, each with its value at its end |
| Show as percent of total | Off (stacked only) | |
| Named stacks | Whole number; 8 (with Stack by only) | See Stacked column |
Pareto chart#
| Setting | Choices and default | What it does |
|---|---|---|
| Roll up | Sum (default) or Count of rows | |
| Format | Auto | Format of the columns. The running share is always a whole percent. |
| Named columns | Whole number; 10 | How many get their own name before the rest fold into Other. Empty or 0 draws them all. |
| X axis labels | Diagonal |
The pane notes: "Columns run largest first. The line is the share of the total reached by each column, read on the right axis."
Waterfall#
| Setting | Choices and default | What it does |
|---|---|---|
| Roll up, Format | ||
| Closing total bar | On | Adds a Total bar at the end |
| Lines between steps | On | Thin lines joining each step to the next |
| X axis labels | Diagonal |
Scatter plot#
| Setting | Choices and default | What it does |
|---|---|---|
| X format | Format choices; Auto | Number format of the X axis |
| Y format | Format choices; Auto | Number format of the Y axis |
| Trend line | Off | A straight line of best fit through the dots |
| Start axes at zero | On | Off starts each axis near its smallest value, for numbers far from zero |
The pane notes: "One dot per row of the sheet; rows are not rolled up. Size by makes it a bubble chart: a dot's area follows the number."
Histogram#
| Setting | Choices and default | What it does |
|---|---|---|
| Bins | Whole number from 2 to 60; 8 | How many equal-width ranges the values are split into |
Box plot#
| Setting | Choices and default | What it does |
|---|---|---|
| Format | Auto (drawn as a plain number so medians keep their decimals) | |
| Sort by median | Sort choices; Sheet order | |
| Max categories | Whole number; 12 | 0 keeps every category |
| Outliers as dots | On | Shows values beyond the whiskers as dots |
| Mark the average | Off | Adds a mark at each box's mean |
The pane notes: "Each box holds the middle half of the rows, with a line at the median. The whiskers reach the furthest usual value; anything past them is an outlier. Rows are not rolled up."
Treemap#
| Setting | Choices and default | What it does |
|---|---|---|
| Roll up, Format | ||
| Named tiles | Whole number, at least 1; 8 | How many get their own name before the rest fold into Other (49 at most) |
Funnel#
| Setting | Choices and default | What it does |
|---|---|---|
| Roll up | Sum (default), Count of rows, Average, Minimum, Maximum | How each stage’s rows become one number. Count of rows sizes each stage by how many rows it has, so the funnel needs no number field: leave Value empty |
| Format | Auto (default) | The number format of the stage values |
| Largest stage first | On | Off keeps the field's own order |
| Drop between stages | On | Shows the share lost from one stage to the next |
| Overall rate | On | Shows the share of the first stage that reaches the last |
Gauge#
| Setting | Choices and default | What it does |
|---|---|---|
| Roll up, Format | ||
| Minimum | Number; 0 | The start of the scale. With a field in the Minimum well, the pane says "Set by" that field instead. |
| Maximum | Number; 0 | The end of the scale. 0 rounds up from the value to a tidy number. With a field in the Maximum well, the pane says "Set by" that field instead. |
| First band ends | Number; empty (Half) | Where the first band changes to the second, in the value's own units. Info tip: "Where the red, amber and green bands change, in the value's own units. Lower is better swaps the colors." |
| Second band ends | Number; empty (Three quarters) | Where the second band changes to the third |
| Lower is better | Off | Colours the low end good (green) and the high end poor, for days late, scrap or cost |
The pane notes: "A maximum of 0 rounds up from the value. Left empty, the bands turn at half and three quarters of the range. Lower is better colors the low end good."
Bullet chart#
| Setting | Choices and default | What it does |
|---|---|---|
| Roll up, Format | ||
| Sort | Sheet order | Sorts by the value |
| Max categories | Whole number; empty (All) | Rows drawn |
Heat map#
| Setting | Choices and default | What it does |
|---|---|---|
| Roll up, Format | ||
| Show values in cells | Off | Prints each cell's value |
Calendar heat map#
| Setting | Choices and default | What it does |
|---|---|---|
| Roll up, Format | ||
| Week starts | Monday (default) or Sunday | |
| Weeks shown | Whole number; 53 | The latest weeks drawn. Empty or 0 draws every week. |
| Show values in days | Off | Prints each day's value in its square, when the squares are big enough |
The pane notes: "A square per day and a column per week, darker for more. Days with no rows stay empty."
Region map#
| Setting | Choices and default | What it does |
|---|---|---|
| Roll up, Format | ||
| Hexes per row | Whole number; 0 | How many hexagons per row. 0 lays the regions out in a near-square block. |
Gantt chart#
| Setting | Choices and default | What it does |
|---|---|---|
| Progress % | Days elapsed (default), the name of your Progress % field (when one is set), None | Days elapsed is the days since the start over the days in the whole span. The field option reads a 0-100 column. None hides progress. |
| Max rows | Whole number; 40 | Rows drawn; 0 draws every row |
| Open at today | On | Opens the timeline scrolled to today, with a little of the recent past on the left |
The pane notes: "One bar per row of the sheet. 0 draws every row. Status reads on track, at risk, delayed, complete or planned."
A Gantt chart can open other visuals under its tasks: see Nested visuals.
Matrix#
| Setting | Choices and default | What it does |
|---|---|---|
| Roll up, Format | ||
| Row layout | Expand (default), Columns (classic) (with two or more Rows fields only) | Expand lists the first Rows field's values, each opening a matrix of the next Rows field under it. Columns (classic) gives each Rows field its own column, each row the whole combination of values, as Excel's classic pivot layout does. |
| Show totals | On | A total row and column (a total row in a flat table). In the classic layout, also a subtotal row after each group; with several Values in a cross-tab, a total column per value. In the expand layout a row that opens is the total of the rows under it. |
| Show level headers | Off (Expand, with two or more Rows fields only) | A row naming the next Rows field over the rows each opened row shows. Off, only the first field is named, in the table's heading. |
| Level colors | A shade darker each level | The strip down the left of each level of rows under an opened row (expand layout), and of the nested visuals' band, one picker per level ("Product rows", "Month rows", "Nested visuals"). Default goes back to the shade. |
| Show row totals | Off (with two or more Values only) | A Row total column at the right adding up each row's values, every value under every column, on every row, subtotal and total. |
| Shade by value | On | Shades cross-tab cells by size, or draws data bars in a flat table. With several Rows fields in the classic layout, or several Values, each value's cells are shaded on their own scale. |
| Wrap headers | Off | Lets long header labels run onto more lines instead of one |
Row levels and extra values are fields: drag up to five fields into Rows (the first is the top level; drag them within the well to reorder the hierarchy) and up to six number fields into Values, in the order they show (see Visual types). Nested visuals open from the last level's rows in the expand layout, and from each combined key's row and cells in the classic layout: see Nested visuals.
Grid#
| Setting | Choices and default | What it does |
|---|---|---|
| Size | S, M, L (default) | Text size and cell padding |
| Column filters | Off | Adds a filter row under the headers: type to filter a column, or click its filter icon to tick values. These filters apply to this grid only. |
| Wrap headers | Off | Lets long header labels run onto more lines instead of being cut off |
| Editing | Off | Lets readers edit rows. The pane notes: "Saved edits write back to the dataset: every visual on it updates, and the Data pane exports them." |
| Allow adding rows | Off (shown with Editing) | Adds an Add New + button |
| Allow deleting rows | Off (shown with Editing) | Adds a delete button on each row (with a confirmation) |
| Read-only columns | Well; empty (shown with Editing) | Columns that stay fixed while the rest of the row can be edited. Calculated columns are always read-only. |
How editing works: each row gets an Edit button; change the cells and click Save (or Cancel). A message confirms "Row updated", "Row added" or "Row deleted". Editing stays available when the report is viewed rather than edited. Keeping a row only keeps it in the report: on Plus and Ultimate the edits reach a stored dataset when someone clicks Save changes in the Data pane or Save all edits in the toolbar (see Saving grid edits); on Mini they last for the session and can be exported.
What governs the editable columns. These settings can narrow what the grid's dataset allows, never widen it. On a stored dataset, the dataset's write-back decides first:
- A column can be edited only when the dataset lets you change it: every column but the key fields on an uploaded dataset, and only the fields its update actions write on any other dataset (one filled from a data source, a query or a replay dataset). Key fields are never editable; calculated columns and the Read-only columns well are read-only too.
- Allow adding rows shows Add New + only when the dataset takes new rows; the new row has only the columns the insert writes, with the required ones marked.
- Allow deleting rows shows the delete button only when the dataset takes deletes.
- A cell can be emptied only when the dataset can clear that field; otherwise the row isn't kept and the grid says "Field: this field can be changed but not emptied."
- While a save of the dataset runs, the grid is read-only and shows the progress, ending "Editing is paused until it finishes."
Plan availability: the Editing settings (and Nested editing below) appear on Mini, Plus and Ultimate only. On Free they are not shown, and a grid saved with Editing on is read-only.
Other grid behaviour (not settings): click a header to sort (Ctrl+click for more sort columns), drag headers to reorder (the Columns well follows), and drag a header's edge to resize a column.
Conditional styling. Colours cells or whole rows where a rule holds. Covered in Conditional styling in the grid.
A grid can open other visuals under its rows: see Nested visuals.
Nested visuals#
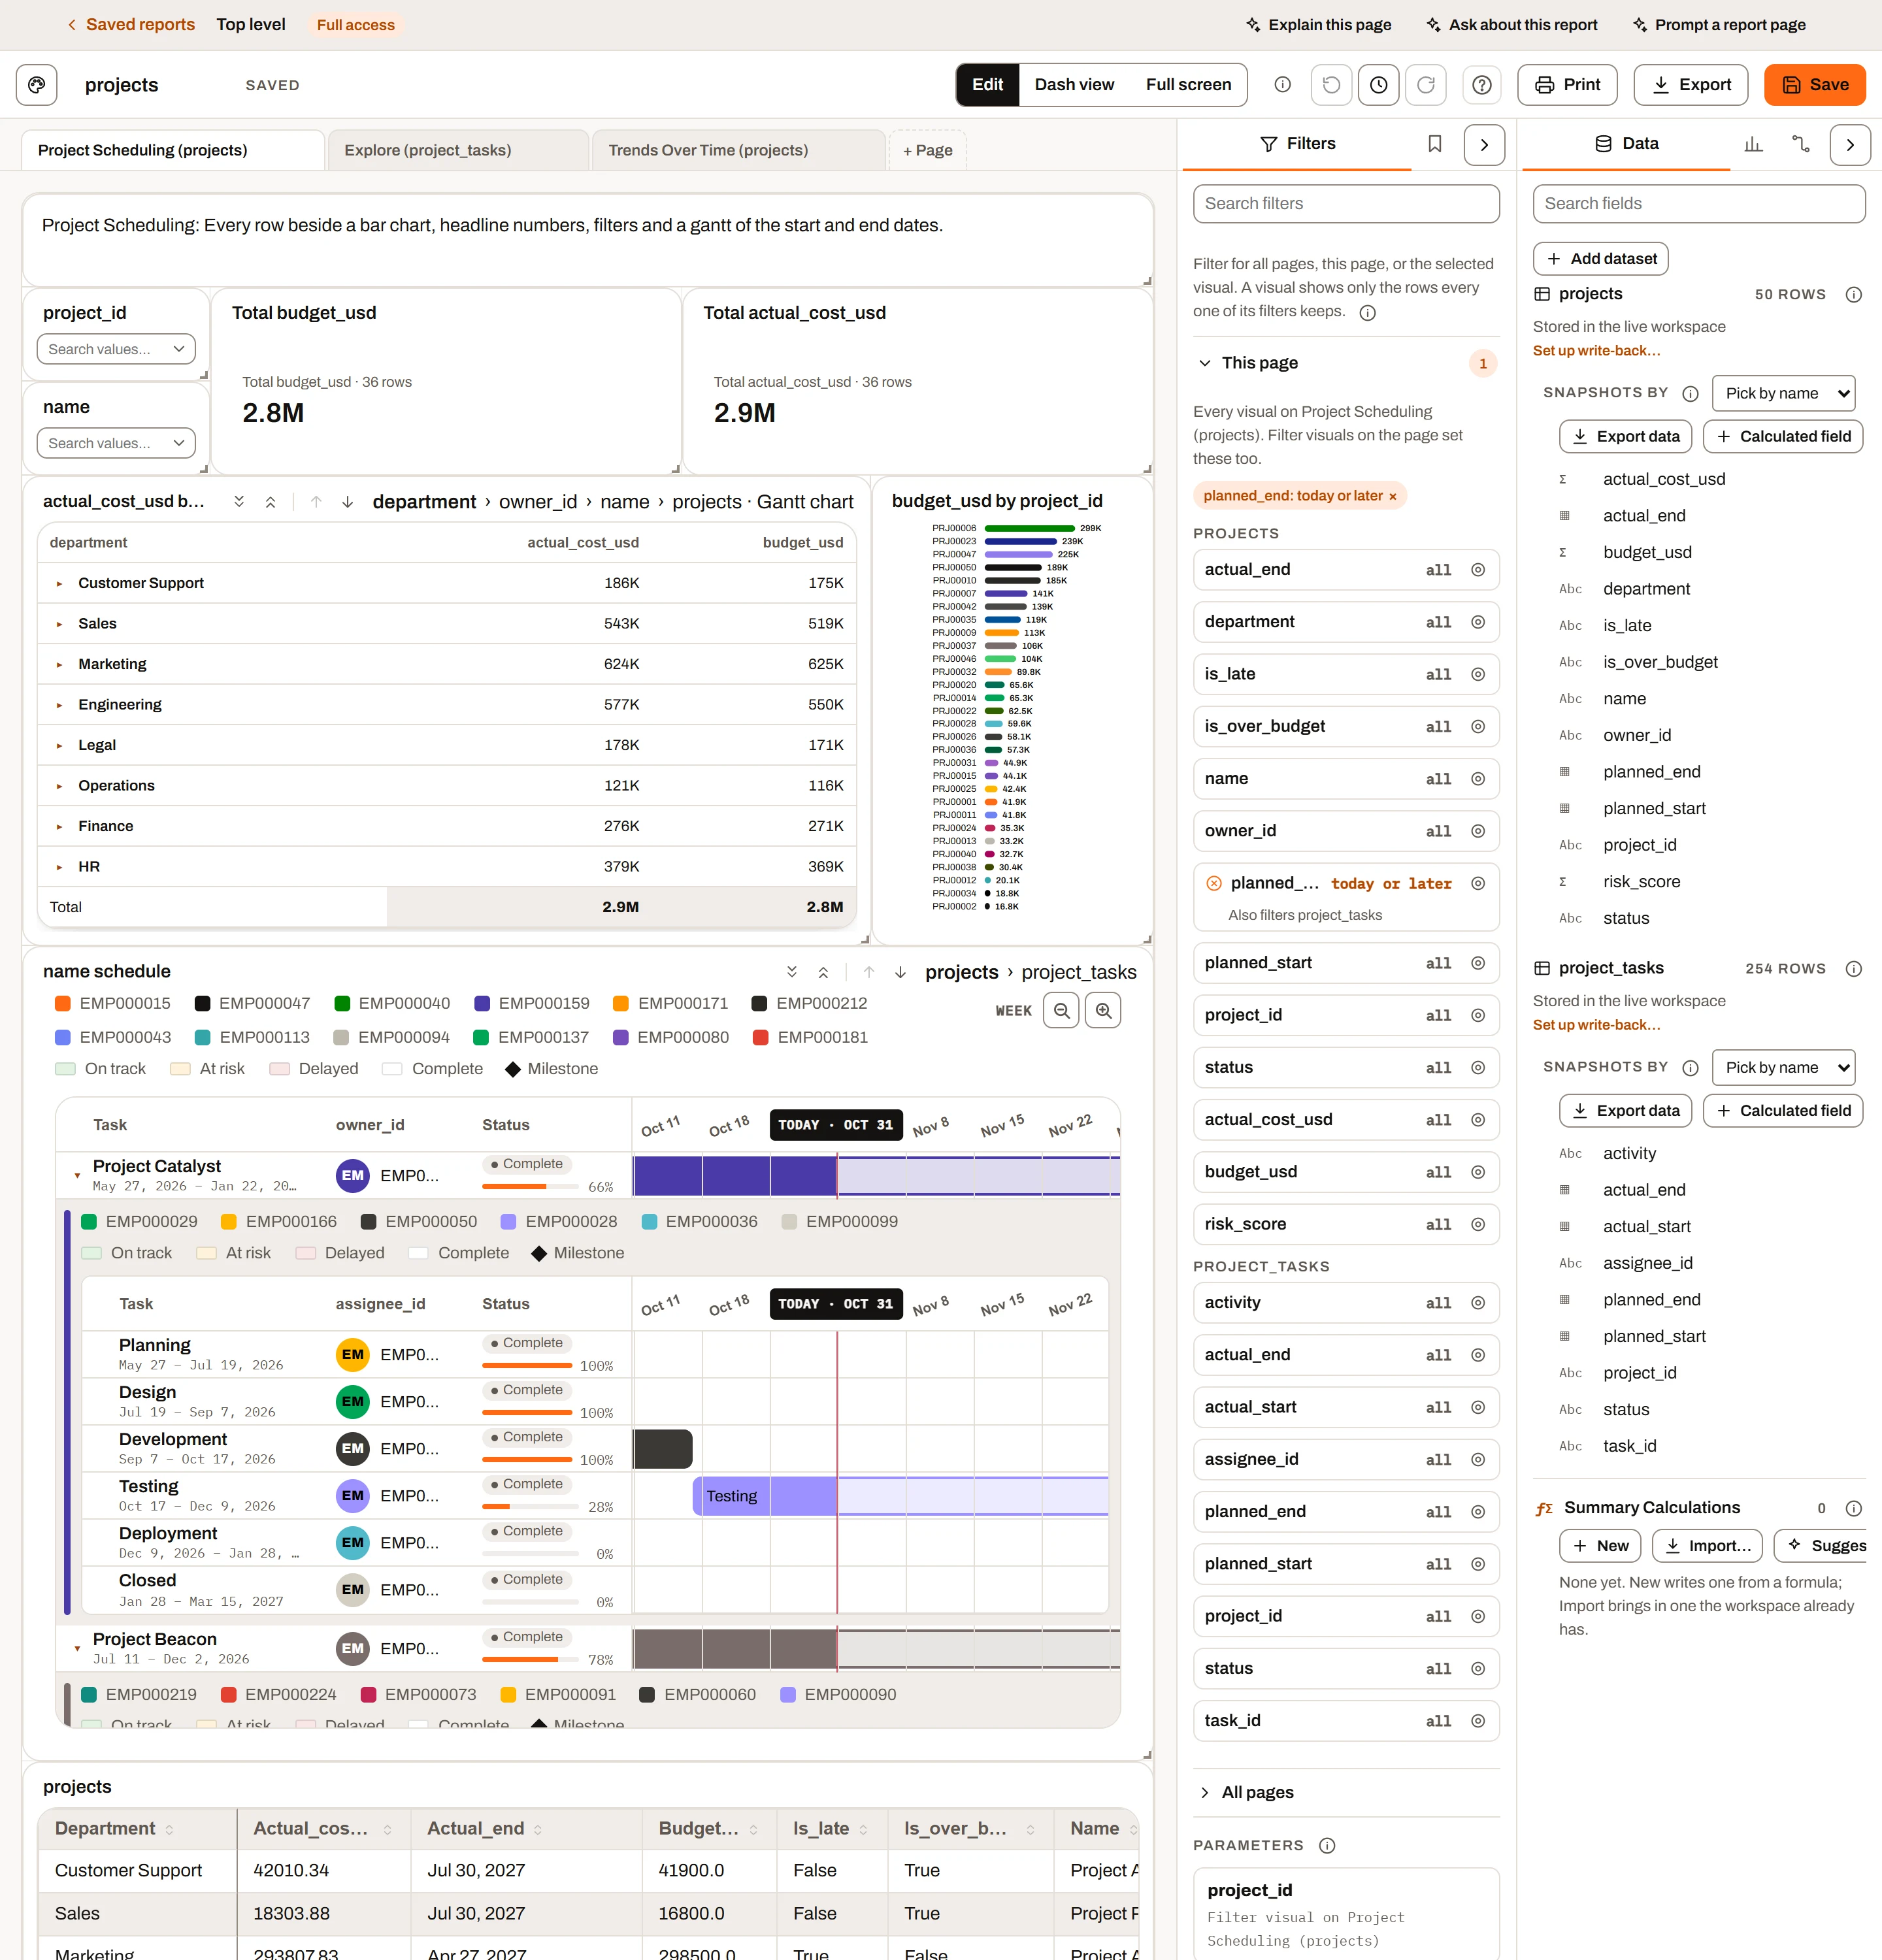
Nested visuals on the projects report: the level strip above the grid (department › owner_id › name › Gantt chart), and a row opened to the level under it.
On a Grid, Gantt chart or Matrix, the Nested visuals section opens a visual of a connected dataset under each row, up to 4 levels deep. Each level is drawn as a Grid, a Gantt chart or a Matrix, whatever the level above is, so they mix freely: projects in a grid, each opening a Gantt chart of its tasks, each task opening a grid of its time entries. Info tip: "Opens a grid, gantt chart or matrix of a connected dataset under each row of this one, up to 4 levels deep: each nested row can open the next level the same way, as any of the three. A matrix opens from its rows, cells and totals, filtered by what they summarise. Needs a connection between each pair of datasets, from the Connections tab."
Each level has its own block, indented under the level above. Pick a dataset in the last Level box to add the next level (it starts as a grid); set a level back to None to remove it and every level under it.
| Setting | Choices and default | What it does |
|---|---|---|
| Level 1 to Level 4 | None (default), or any dataset in the report (the dataset of the level above, or the visual's own for Level 1, is marked "(this row)") | The dataset whose rows open under each row of the level above: the level's starting point. Picking another dataset starts its fields again, filled in the way a new visual of its type would be. |
| Show as | Grid (default), Gantt, Matrix | How the level is drawn. Changing it starts the level's fields and settings again, and fills its fields the way a new visual of that type would be: a Gantt chart takes the columns that read as task, start, end, status, owner and progress; a matrix takes the first text column as its rows and the first number column as its value. |
| Wells | The kind's own: Columns for a grid (every column of the dataset by default; at least one stays); Task, Start, End, Status, Owner and Progress % for a Gantt chart; Rows, Columns and Values for a matrix | The level's fields. Fields come from the level's dataset or from a dataset connected to it, as on a visual of its own: a connected field (shown as "Projects · Lead") is looked up onto each of the level's rows, so it can be a grid column, a Gantt chart's task or owner, or a matrix's rows or columns. A connected dataset's number can be the value a nested matrix totals: it is totalled over that dataset's own rows under the same parent row (a project's tasks by status beside the project's expenses, say), never repeated per row. A field from a dataset the connections can't reach says why and offers to switch the level to that dataset. |
Grid levels:
| Setting | Choices and default | What it does |
|---|---|---|
| Limit visible nested grid area | Off | On, each nested grid shows its first rows and scrolls the rest |
| Rows shown | Whole number, at least 1; 5 (shown when limited) | How many nested rows show before scrolling |
| Nested editing | Off (Mini and above; not for "(this row)") | Lets nested rows be edited; their edits belong to that level's dataset, and each row is saved to it as soon as you save it, under its own write-back rules |
| Conditional styling | No rules | Colours that level's cells or rows, the same way as the grid's own rules (see Conditional styling in the grid) |
Gantt levels:
| Setting | Choices and default | What it does |
|---|---|---|
| Progress % | Days elapsed (default), the Progress % field when one is set, None | As on a Gantt chart of its own |
| Long text | Truncate (default), Wrap | How task, owner and status text that doesn't fit its column shows. Truncate keeps one line and shows the rest on hover; Wrap runs it onto more lines and the row grows to fit. |
| Rows shown | Whole number; 10 | Tasks shown before the rest scroll inside the band; 0 shows every task |
| Open at today | On (only when no Gantt chart is above the level) | Opens the timeline scrolled to today |
Matrix levels:
| Setting | Choices and default | What it does |
|---|---|---|
| Roll up, Format | Sum, Auto | As on a matrix of its own |
| Show totals, Shade by value | On, On | As on a matrix of its own |
| Rows shown | Whole number; 10 | Rows shown before the rest scroll; 0 shows every row |
How the nested rows are chosen, at every level:
- Linked datasets: each row shows the nested rows that match on every connected column pair with the level above, for example "Each Orders row shows the Lines rows where Order ID = Order ID."
- Not linked: a warning says "Not linked. ... so every nested visual shows all ... rows", with a Link datasets button that opens the Connections tab.
- This row: a grid or Gantt row opens to its own values. When a grid row above is being edited, editing it edits a nested grid's columns with it.
- Under a matrix: a matrix row opens filtered by its row value, a cross-tab cell by its row and column values, and a total by every row behind it. The band names the filter ("Region: East · Quarter: Q2"). On the matrix's own dataset that is the detail rows behind the figure; on a connected dataset, the rows linked to any of them; under a nested matrix, a further breakdown of the same rows. A cell's arrow shows when you point at the cell.
What you see:
- Only rows that have nested rows get an expand arrow. Nested rows follow the page's filters and any selections that reach that dataset.
- Each nested visual has a coloured strip down its left edge: the owner colour of the Gantt task it opened under, or the accent colour under a grid or matrix row.
- A nested Gantt chart shows its legends in a strip just above its column headers.
- A nested Gantt chart under another Gantt chart (directly or through grids and matrices in between) follows that chart's timeline: the same dates, zoom and scroll, and its Owner and Status columns line up under that chart's. Its Task column is narrower by the width of the strip. Scrolling sideways or zooming over it moves the chart it follows. With no Gantt chart above, it has its own timeline and zoom.
Drilling. A visual with nested visuals can also be drilled: drill down takes its top layer off and shows the next level as the visual, drill up puts it back. A matrix with several Rows fields drills down those first, one field at a time, then into its nested visuals. The tile's header has the arrows and a breadcrumb of the levels. See Drill down. While the visual is drilled, this section starts with "Showing level n: dataset" and Back to the top; removing the level it shows drills it up to the deepest level left.
Filter#
| Setting | Choices and default | What it does |
|---|---|---|
| Filter by | Pick values, Range slider, Conditions (>, <, =…), Year and month (only the modes the field's type supports; hidden when there is only one) | How readers filter. Changing mode clears the page's current filter on that field. |
| Display | Buttons or Drop-down (default for new Filter visuals) | Pick values only. Buttons show each value as a pill; Drop-down shows a box with the picked values as removable chips. |
| Type to search | On (Drop-down only) | Typing in the box narrows the list. Off makes the box a plain select. |
| Selection | Multiple (default) or Single | Pick values only. Single keeps at most one value picked; switching to Single keeps only the first value already picked. |
| Selected | Colour; Default (theme highlight) | Fill of picked buttons, chips and the slider's picked stretch |
| Unselected | Colour; Default (tile colour) | Buttons display only: fill of unpicked buttons |
Button and chip text turns black or white, whichever reads better on its colour. Mode hints in the pane:
- Range slider: "Drag either end of the slider to filter the page to that range. The selected color fills the picked stretch." With too few values the visual says "Not enough values for a range."
- Conditions: "Click the filter to add comparisons (=, ≠, >, ≥, <, ≤) and whether all or any of them have to hold." Readers choose All (and) or Any (or).
- Year and month: "Pick whole years or single months; a month keeps every date in it."
What the filter does to the page is covered in Filters and interactions.
Text#
| Setting | Choices and default | What it does |
|---|---|---|
| Style | Heading, Subheading, Body (default) | Text size and weight (22, 16 or 14 px by default) |
| Align | Left (default), Center, Right |
Type straight into the text on the page. Fonts can be changed under Fonts (piece Text).
Image#
| Setting | Choices and default | What it does |
|---|---|---|
| File | Choose a picture…; Replace… and Remove once there is one | Stores a PNG, JPEG, GIF, WebP or SVG of up to 1 MB in the report (8 MB of pictures per report). The pane shows its name and size. |
| Or an address | An https:// address | A picture on the web, loaded by each reader's browser |
| Fit | Fit (default), Fill, Stretch | Fit shows it whole inside the tile, Fill covers the tile and crops, Stretch makes it the tile's shape |
| Align | Left, Center (default), Right (with Fit only) | Where a fitted picture sits across the tile |
| Link | An address; empty (None) | Opens when the picture is clicked in Dash view; while editing, Ctrl+click |
| Alt text | Text | Read out by screen readers, and shown on hover |
While editing, a picture file dropped on the tile replaces its picture. An image has no Fonts, Display, Colors or Interactions sections.
Shape#
| Setting | Choices and default | What it does |
|---|---|---|
| Shape | Rectangle (default), Rounded rectangle, Oval, Line | |
| Fill | Colour, a theme colour, or None; default Brand, light | The inside. A theme colour (Brand, Brand light, Ink, Line, Surface) follows the report's theme. Not on a line. |
| Outline (Color on a line) | Colour, a theme colour, or None (default) | Picking one shows its width and style. A line with no colour of its own is drawn in the ink colour. |
| Outline width (Thickness on a line) | 0 to 12; 1 | |
| Style | Solid (default), Dashed, Dotted | |
| Corner radius | 8 (rounded rectangle only) | |
| Direction | Across (default), Down, Diagonal, falling, Diagonal, rising (line only) | |
| Opacity | 0 to 100%; 100% | How much of the shape shows; lower lets the page show through |
A new shape goes behind the other visuals; Bring to front and Send to back are in every visual's More options menu. A shape has no Fonts, Display, Colors or Interactions sections.
Report theme and visual colours#
The report's theme sets the starting colours for every visual on every page. Open it from the toolbar's Report theme button (palette icon). Choosing the theme is covered in Report builder; this is how it affects visuals.
- Presets: Insight FastPass (the site's colours, following light and dark mode; the default), Classic, Ocean, Forest, Slate, Sunset, Colorblind safe and Midnight (bright colours on a dark navy page). Each preset sets the accent, the 8 series colours, the sequential ramp and the increase/decrease pair. Use site colors goes back to the default.
- Customize: Accent (selection and Filter highlights), Background, Tiles and Text, plus Chart colors (series, sequential and diverging swatches) for the whole report.
- Order of precedence: a colour picked on a visual wins over the report theme ("A visual's own colors still win."). Value colours picked with Match colors in other visuals on apply to all visuals sharing that field. Unpicked values and slots follow the theme, so changing the theme recolours them.
- A KPI card's Background/Text and a Filter's Selected/Unselected colours are fixed colours and do not follow the theme.
Resetting settings#
| To reset | Do this |
|---|---|
| Any change you just made | Ctrl+Z (undo), or the toolbar's Undo button |
| A number box with a "None", "Default", "All" or "Automatic" placeholder (Goal, Target line, Flag at or above/below, Decimal places, Caption, Named slices, band ends and so on) | Clear the box |
| KPI Background / Text, Filter Selected / Unselected | Click Default or Auto beside the colour |
| Bar spacing | Click the pixel value to go back to Auto |
| One value's colour | Click its reset arrow |
| All value colours | Reset all |
| Palette swatches | Reset under the swatches |
| One font piece | The x at the end of its row |
| All fonts | Reset fonts |
| A field's label on this visual | Rename it and clear the text (the chip's placeholder shows the column name) |
| A typed title | Rename the visual back to its automatic title; it then follows the fields again |
There is no single "reset this visual" button. To start a visual over, delete it and add a new one.
Plan limits summary#
| Feature | Free | Mini | Plus | Ultimate |
|---|---|---|---|---|
| All settings for the ten core visuals (KPI card, Bar, Column, Pie, Grid, Filter, Text, Image, Shape, Button) | Yes | Yes | Yes | Yes |
| Settings for the other 23 visual types | No (types not available) | Yes | Yes | Yes |
| Grid Editing, Allow adding rows, Allow deleting rows, Read-only columns, Nested editing | No | Yes | Yes | Yes |
| Grid edits kept after the session | No | No (export only) | Yes, with Save changes | Yes, with Save changes |
| History (snapshot datasets) | No | No | No | Yes |
| Calculated metric, Show only rows where, Display, Colors, Interactions, Fonts | Yes | Yes | Yes | Yes |
The Editing hint says how edits are saved: "An edit updates every visual on the dataset at once. A stored dataset saves each row as soon as you save it in the grid; only the columns the dataset lets you change can be edited." Nested editing says "Nested edits change dataset, and each row is saved to it as soon as you save it."