
Docs › Build reports
Printable reports
A printable report is a paginated document, such as an invoice, a statement, an aging report or a list, designed band by band and saved as a PDF or an Excel workbook. It sits beside the dashboard builder and uses the same datasets, connections, calculated fields, Summary Calculations, themes and sharing. This guide covers starting one, the designer, bands, boxes and tables, parameters, the preview and its files, scheduled delivery, starting from an .rdl file, and printable reports in the desktop app.
Plan availability: anyone can design a printable report, preview it and save it as a PDF or a workbook, including on Try it (no account), the Free plan's builder, and the demo designer at /print-reports/example. Saving it to a workspace needs Mini, Plus or Ultimate. Scheduled delivery needs Ultimate. The desktop app designs and saves them as files with no account.
What a printable report is#
A dashboard is a set of pages that fit the screen. A printable report is a document that runs over as many sheets of paper as its data needs, with the same layout every time:
- The page is a stack of bands. A taller band pushes everything below it down, and a band that doesn't fit moves to the next sheet.
- Inside a band, boxes (text, fields, pictures, charts, barcodes) go wherever you drag them. Nothing inside a band pushes anything else.
- A table band flows row by row across sheets, with its header repeated at the top of each sheet.
- A page header and page footer print on every sheet (or the sheets you choose), with page numbers and page totals.
- Parameters let one report serve every customer, department or date range: the reader picks the values above the preview.
The preview, the PDF saved from your browser and a PDF sent by a schedule are drawn from one layout, worked out once by Insight FastPass itself. They can't disagree about where a line or a page breaks.
Starting a printable report#
From the Reports page#
- On the Reports page, click New report.
- Under the kind, choose Printable report.
- Under Start from, choose:
- Blank report (the default): "An empty page with no header, footer or bands." Add them from the designer's Insert tab, and datasets from its Data tab.
- A table of the first dataset.
- One of the six templates (see Templates). The hint under it says which columns it needs: "the columns are found by their names".
- From an SSRS report (.rdl) (see Starting from an .rdl file).
- For a table or a template, tick where the data comes from under Data and pick the datasets (see Saved reports). A printable report's datasets are read each time it runs.
- Click Create report. The designer opens. The report isn't created in the workspace until you click Save.
A printable report is listed on the Reports page with a Printable chip, and opens at its own address, /account/print-reports/owner/report. See Saved reports for folders, saving and report limits.
On Try it and the Free plan#
On Try it and the Free plan's New report page, pick Printable report under What to make before you drop a file. The report is made as that kind and stays it. The spreadsheets are held in memory while the page is open, and nothing is kept when it closes.
The demo designer#
/print-reports/example opens the designer on sample data, with no sign-in: a set of September invoices for six customers, with their invoice lines, a Customer parameter, a running balance, a new sheet per customer and page totals in the footer. Every part of the designer works there, including PDF and Excel. Nothing is saved.
Templates#
Each template reads one dataset and finds the columns it needs by their names.
| Template | What it makes |
|---|---|
| Invoice | One invoice per customer (or per invoice number): the address block, the lines, a running balance and the amount due, each on its own sheet |
| Customer statement | A statement per customer: every transaction with a running balance and the balance due, each customer on a new sheet |
| Accounts receivable aging | Open amounts by customer in Current, 1–30, 31–60, 61–90 and over 90 days, with customer subtotals and a grand total |
| Purchase order | One purchase order per PO number: vendor, dates, the lines with quantities and costs, and the order total, each on its own sheet |
| Inventory list | Items grouped by location or category with quantity on hand, value and anything at or below its reorder point highlighted |
| Job cost | Budget against actual by job and cost code, with the variance, the share of budget used and overruns highlighted |
In the designer, the Insert tab lists the same templates under Templates ("Adds a ready-made layout after the body, built from the columns it finds."). Each says which dataset and columns it would use ("From dataset: …"), or "Needs …" naming the columns it couldn't find, in which case Add is greyed out. Add is one undo step.
The designer at a glance#
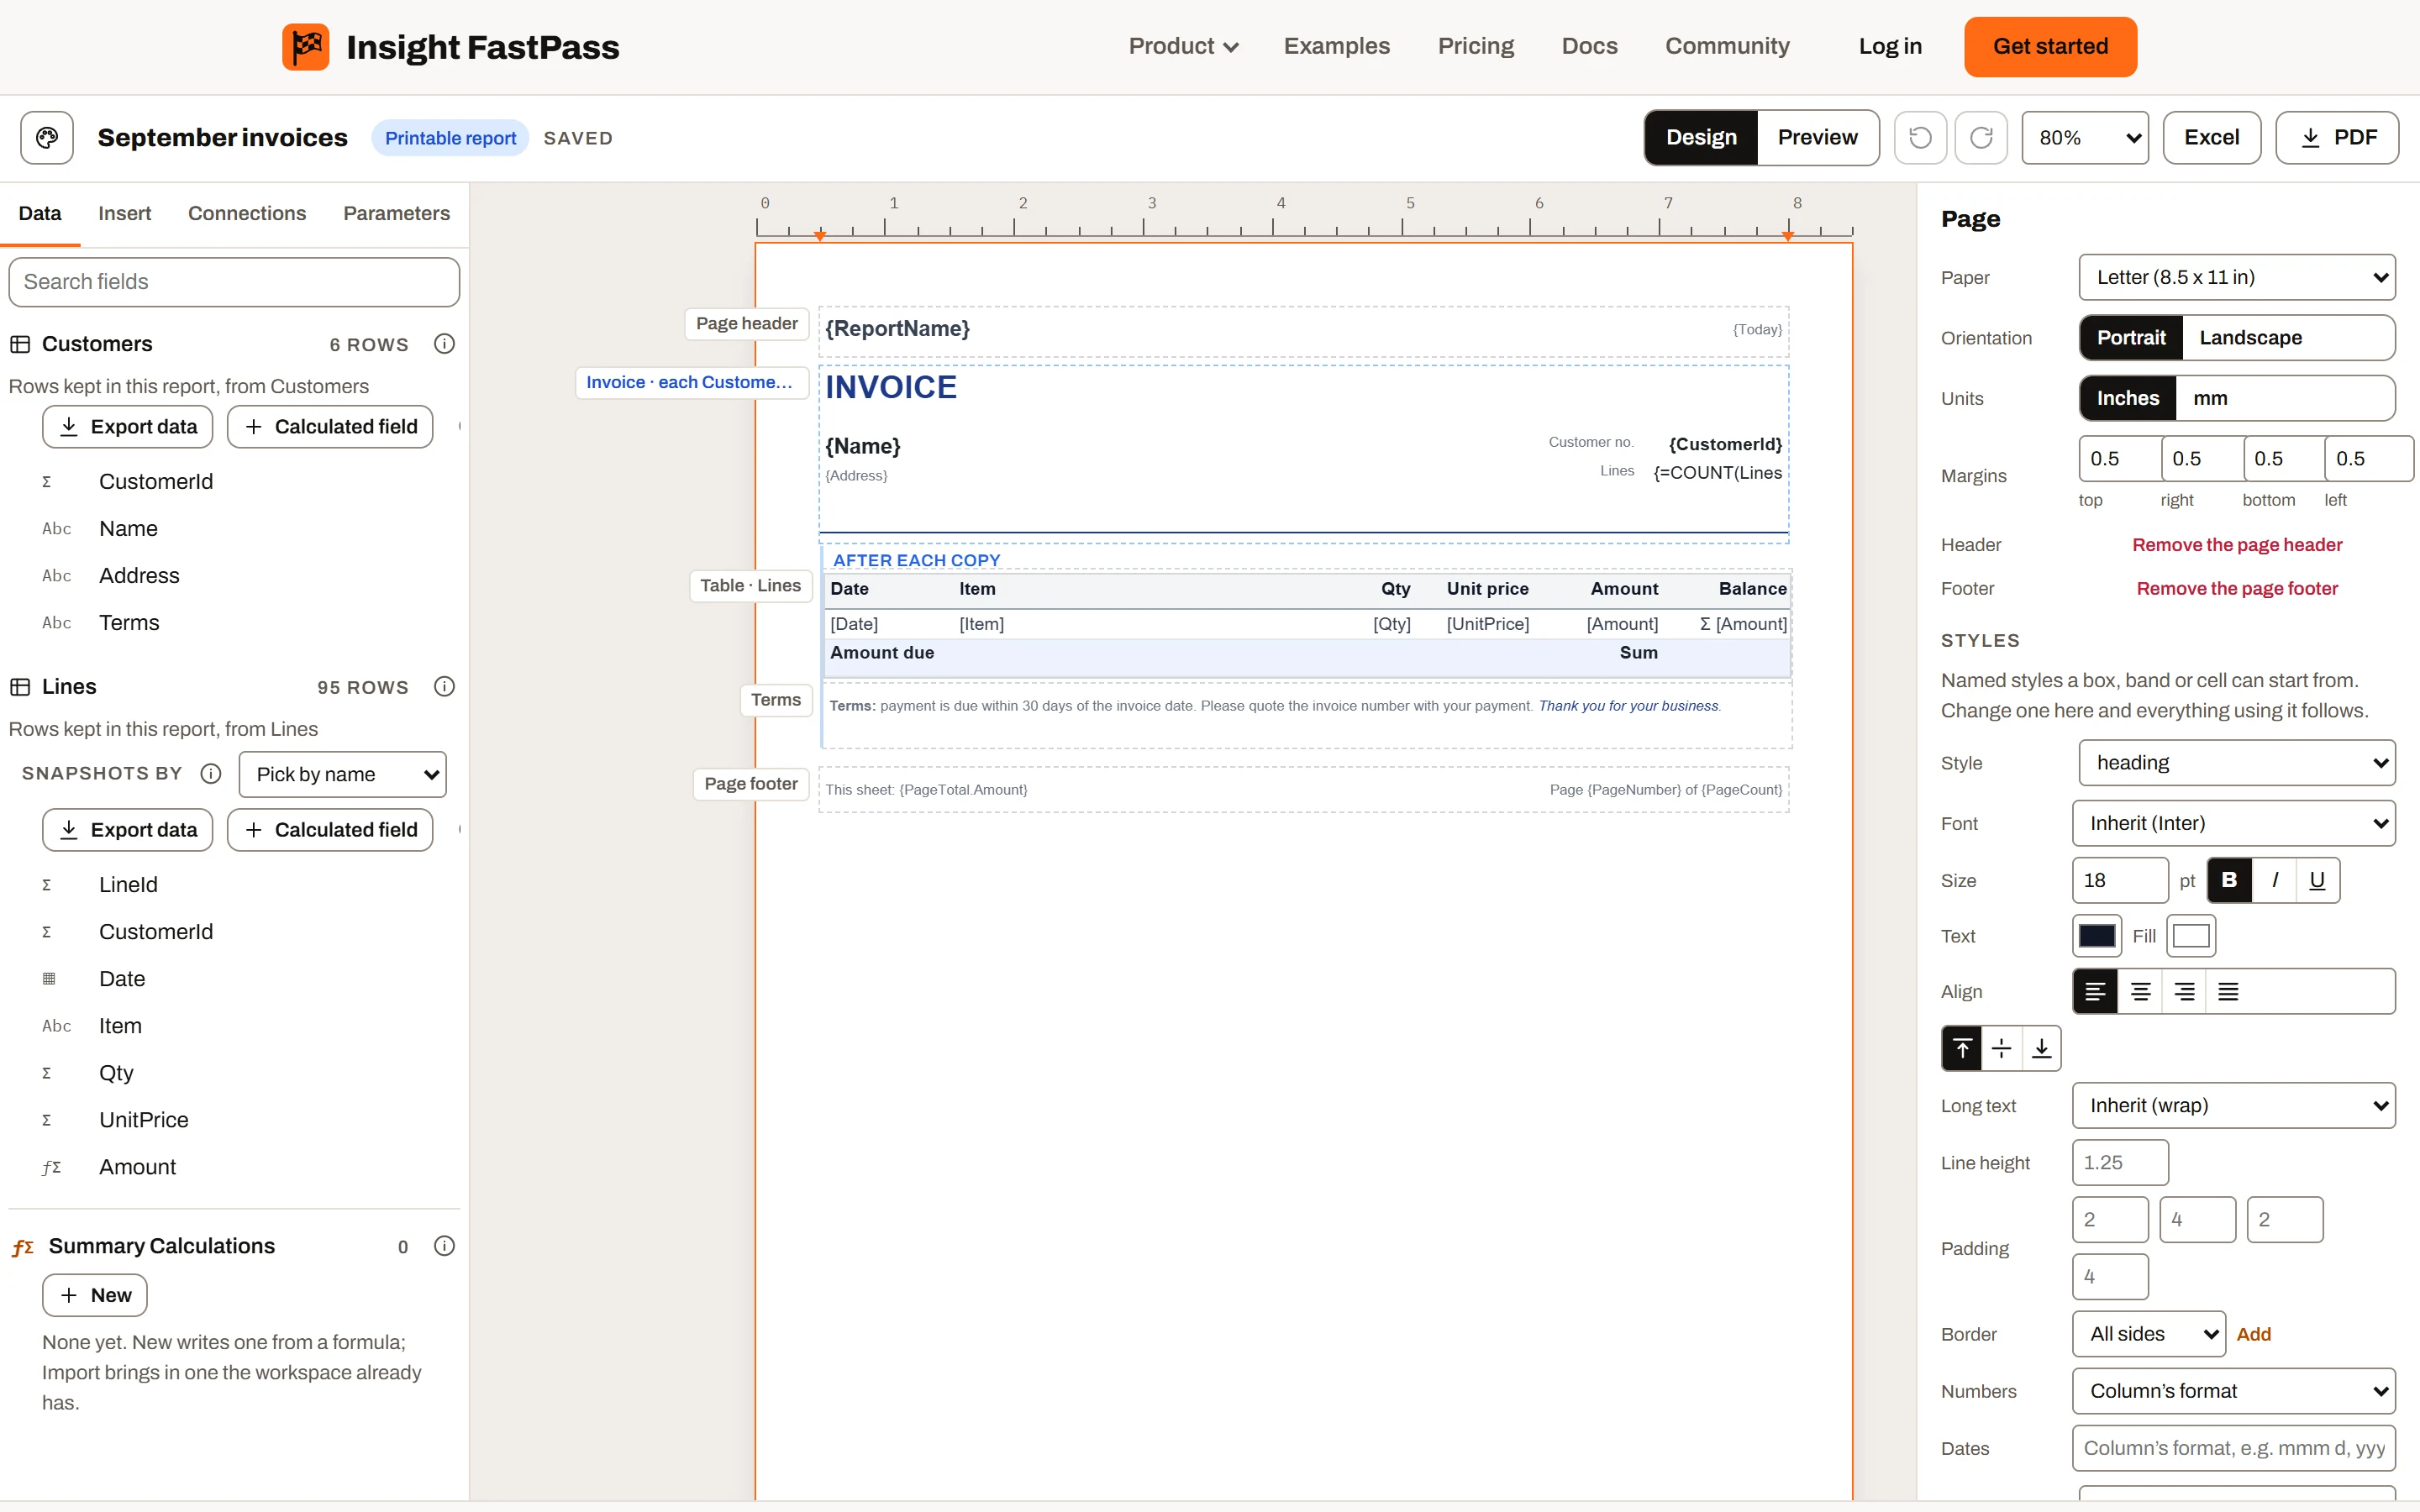
The printable report designer, on the demo invoice.
| Part | What's there |
|---|---|
| Toolbar | The theme, the report's name (click to rename), Saved / Unsaved, Design / Preview, undo and redo, zoom, Excel, PDF, Schedule, Save as… and Save (Ctrl+S) |
| Rail (left) | Data (the datasets, fields, calculated fields and Summary Calculations, as on a dashboard), Insert (bands, boxes and templates), Connections (shown once two or more datasets are loaded) and Parameters |
| Canvas | The page at paper width with its margins and a ruler: the page header, the body bands and the page footer |
| Properties (right) | Settings for what is selected: the page, a band, a box, a table, a column or a group |
Below edit access, the designer opens on the preview: the parameters, the sheets, and PDF and Excel.
The page#
Click an empty part of the canvas to set up the page:
- Paper: Letter (8.5 x 11 in), Legal (8.5 x 14 in), Tabloid (11 x 17 in), A3, A4 or A5.
- Orientation: Portrait or Landscape.
- Units: Inches or mm, for the rulers and every size in the properties pane. Font sizes are always shown in pt.
- Margins: top, right, bottom and left.
- Header and Footer: Add a page header, Add a page footer, or remove them.
- Styles: named styles a box, band or cell can start from. "Change one here and everything using it follows." Type a name in New style and press Enter to add one.
Keyboard shortcuts#
| Keys | Does |
|---|---|
| Ctrl+Z / Ctrl+Y | Undo / redo |
| Ctrl+C / Ctrl+V | Copy / paste the selection |
| Ctrl+D | Duplicate |
| Delete or Backspace | Delete the selection |
| Arrow keys | Nudge 1 px; with Shift, 10 px |
| Esc | Clear the selection |
| Ctrl+S | Save |
Bands#
The Insert tab adds three kinds of band:
| Band | What it's for |
|---|---|
| Band | "A block drawn once: a title, an address, totals" |
| Row band | "Drawn once per row or per group: invoices, statements, labels" |
| Table | "Columns, groups with subtotals, a total row; flows across sheets" |
Select a band to set, in the properties pane:
- Name and Height.
- Keep together (move to the next sheet rather than split), on by default.
- Start on a new sheet.
- Start beside the band above, with Down from its top: for things side by side. The preview places the band level with the one above; the design view still stacks them and labels the band "beside the band above".
- Hide when: a formula that hides the band when it gives TRUE (see Hiding things with Hide when).
Repeating a band#
Under Repeat, tick Repeat this band for each row (or group) of a dataset, then choose:
- Dataset: the dataset whose rows it repeats over.
- Once per: each row, or each distinct value of the fields you tick (one copy per customer, for example).
- Sort: + Sort by a field, A–Z or Z–A.
- Only rows where: conditions on the rows, with the same editor as elsewhere in Insight FastPass.
- Number each copy's sheets from 1 (each starts on a new sheet): so each invoice has its own page 1 of 2.
- Page name: a name for each copy's sheets, such as
Customer {Group.CustomerId}. It shows as{PageName}in a header or footer, and as the PDF's page labels and bookmarks.
After each adds what follows every copy: + Table of its rows, + Row band or + Band. A table under a row band lists that copy's rows (an invoice's lines). A row band can hold another row band, three levels deep at most (customer, order, lines). A child band can repeat over The row band's rows, or over a dataset linked to the parent's in Connections, in which case it reads each copy's linked rows.
Page header and footer#
The page header and footer print on the sheets Print on says:
- Every sheet
- All but the first
- All but the last
- All but the first and last
"A sheet without it gives its height to the body." Page numbers and page totals belong here (see Text, tokens and formulas).
Boxes#
Click a box under Boxes on the Insert tab to add it to the selected band (or a new band), or drag it onto any band. You can also drag a field or a Summary Calculation from the Data tab onto a band.
| Box | What it holds |
|---|---|
| Text | Words, with {Tokens} and {=formulas} |
| Field | One value: a field, a Summary Calculation or a formula |
| Picture | A logo or a signature (PNG or JPEG), from A file, or from A field whose value is a picture or an https address |
| Line | A rule across the band |
| Rectangle | A box behind other boxes |
| Chart | Bar, column, stacked column, line, area, pie or donut |
| Barcode | Code 128, EAN-13 or QR code of a field or formula. "EAN-13 takes 12 digits (the check digit is added) or 13." |
| QR code | Typed in, or From data: values from fields, summarised over the rows in scope, filled into a template. Encode values for a web address, Error correction, and Print the text under the code |
Moving and lining up boxes#
- Drag a box anywhere in its band. With Snap to other boxes while dragging on (the Insert tab), it snaps to the edges and centres of other boxes and the band. Hold Alt to drag freely, Shift to keep to one direction.
- Drag any of the eight handles to resize it.
- Select several boxes to align and distribute them.
- Double-click a text box to type in it. Bold, Italic and Underline (Ctrl+B, Ctrl+I, Ctrl+U) apply to the selected words only.
- Bring to front, Send to back, Duplicate and Delete are in the box's properties.
- Add a link (drillthrough) makes a box open A report or A web address when clicked, in the preview and in the PDF.
The design view lays text out with your browser. The exact layout, line breaks included, is the one on the Preview tab and in the PDF.
Text, tokens and formulas#
A text box mixes literal text with tokens in braces and formulas:
| Token | Shows |
|---|---|
{PageNumber}, {PageCount} | This sheet's number and the sheet count, counted within a run of sheets when numbering restarts |
{OverallPageNumber}, {OverallPageCount} | The same over the whole document |
{PageName} | The sheet's page name |
{ReportName}, {Today}, {Now} | The report's name, today's date, the date and time |
{Field} | A field of the current row (or a parameter's text) |
{Dataset.Field} | The linked row's field, or the dataset's first row |
{Group.Field} | The group's first row |
{Parameter.Name} | A parameter's value as the parameter bar shows it |
{Summary.Name} | A Summary Calculation over the rows in scope |
{PageTotal.Column}, {CarriedForward.Column} | A column's total on this sheet, and its total brought forward from the sheets before |
{=formula} (or text starting with =) is a formula in the same language as calculated fields (see Formulas and Summary Calculations), with these extra functions in a printable report:
PARAMETER("Name")is a parameter's value as its type; a list of several values reads as"a, b", soCONTAINS(PARAMETER("Regions"), [Region])works.PARAMETER("Name", "to")is a date range's other end.PARAMETERTEXT("Name")is the value as the parameter bar shows it.LOOKUP("Dataset", "returnField", "matchField", value)returns the first match from another dataset;LOOKUPSUM,LOOKUPCOUNT,LOOKUPMIN,LOOKUPMAXandLOOKUPAVERAGEroll up every match. Where the datasets are connected, you don't need a lookup:Customers[Name]reads the connected row, as in calculated fields.PAGENUMBER(),PAGECOUNT(),OVERALLPAGENUMBER(),OVERALLPAGECOUNT(),PAGENAME(),REPORTNAME(),PAGETOTAL("Column")andCARRIEDFORWARD("Column")."Page " & PAGENUMBER()works anywhere; arithmetic on page values works only in a page header or footer.RUNNINGTOTAL([Amount])is the total so far, in the band's order.
Tables, groups and totals#
A Table band lists a dataset's rows. Drag fields or Summary Calculations from the Data tab onto the table to add columns, or use + Add a column…. Drag a column's edge to change its width, and drag a header sideways to move the column.
- Columns: a field, a Summary Calculation or a formula, with a label, width, format, style and Hide when. A field of a dataset connected to the table's adds a joined column (shown as
Lines[Item]). Cells show text or A picture (a PNG or JPEG, or an https address). - Running total (the total so far, row by row), which Starts again at Each group or Never.
- Totals: how the column is totalled in group footers and the Total row, with a Total label.
- Sort and filter: + Sort by and Only rows where.
- Caption rows: rows above the column labels with captions spanning several columns.
- More lines per record: extra lines under each row, with cells spanning columns.
Groups and subtotals#
+ Group by… adds a group, outermost first. For each group:
- Group by: the fields it groups on.
- Group header and Group footer (subtotals), each with its own Hide when.
- Keep each group on one sheet when it fits. A group that continues on the next sheet repeats its header there, marked "(continued)".
- New sheet: Before each group or After each group (one statement per customer).
- Number each group's sheets from 1 (each starts on a new sheet) and Page name (for example
{Group.Region}): the page name also gives each group its own worksheet in Excel. - Group column: "Show the group's values in a column on the left, beside its rows", drawn again on every sheet the group continues on.
Matrix (column groups)#
Column groups (matrix) turns a table into a cross-tab: tick Pivot: repeat once per column-group value (a matrix cell) on a value column, then + Columns by… a field. Each pivot column is repeated once per value of that field, with a total column after them, up to two levels. A matrix wider than the page keeps the columns that fit and says so.
Styles and conditional styling#
Every box, band, column, row kind and cell has a Style: font (the bundled fonts only), size in pt, bold, italic, underline, colour, Fill, Align, Padding, Border per side, Line height, the format for Numbers and Dates, and what Long text does:
| Long text | Means |
|---|---|
| Wrap | "Onto more lines; what doesn't fit the box is cut at the bottom" |
| Grow to fit | "The box (and its band) gets taller so every line shows" |
| Shrink to fit | "The type gets smaller until it fits, down to 6 pt" |
| Cut off with … | "One line, ending in an ellipsis" |
| Cut off | "One line, cut at the box's edge" |
Styles apply outermost first: the named style, then the band, column, row kind and cell. Conditional styling (+ Add a rule) changes the text and fill when a field condition, or a formula, holds; tables can Highlight cells or Highlight rows.
Hiding things with Hide when#
Bands, boxes, table columns, group headers and footers each have Hide when: a formula that hides them when it gives TRUE, such as ISBLANK([Notes]). In a repeated band, it is worked out for each copy. The formula editor checks the formula as the printable report runs it, with its parameters and functions.
Parameters#
"Parameters let one report serve every customer, department or date range. Readers pick values above the preview; a schedule sets them per recipient." Open the Parameters tab and click + Add a parameter. For each one:
- Name (what formulas use,
PARAMETER("Name")) and Label (what the reader sees). - Type: List (its available values), Text, Number, Date, Date range or Yes / no switch.
- Available values:
- None: typed in.
- A list I type: one
value = labelper line. - From a query (a dataset's field): a dataset's Value field and Label field, optionally Narrowed by another parameter.
- Allow several values (lists), Default, Required (nothing renders until it has a value), Allow null value, Allow blank value, and Visible (shown above the report). A hidden parameter keeps its default, or the value a schedule gives it.
- Applies to (+ Apply to a dataset): what the value does to a dataset. narrows the rows read keeps the rows whose field matches. On a live dataset, is sent to the query passes the value to one of the dataset's query inputs, so the read returns the matching rows.
Cascading lists#
A list Narrowed by another parameter shows only the values that go with the parent's value: pick a region, and the Customer list shows that region's customers. The list is read again when the parent changes, and its value is cleared when it is no longer in the list.
Parameters on live datasets#
A dataset read when the report runs (a live or replay dataset, or a database read in the desktop app) gets one parameter per query input when you add it. If an input has no parameter sending it a value, the Parameters tab lists it ("No parameter sends a value to these inputs, so the report reads them as NULL, and the read fails if the source needs a value") with Add a parameter for it. A parameter marked live in the parameter bar reads the data again when it changes. See Live and replay datasets.
Preview, PDF and Excel#
Click Preview in the toolbar. When the report has parameters to set, the parameter bar has Run at its right, and "Set the parameters, then Run." shows until you click it. Nothing is read or rendered until then; change a value afterwards and "Parameters changed" shows until you run it again. Lists that read their choices from a live dataset fill straight away, so you can pick from them before Run.
The strip above the sheets shows the sheet count, Go to a sheet, and the sheet in view's page name and number in its run ("Acme · page 2 of 3"). "n things need a look" lists anything the layout couldn't do as asked, such as a band left out. With live datasets, it also shows "As of" the time of the read and Refresh.
- Save as PDF (or PDF in the toolbar): "Made in your browser from the same layout as the preview."
- Export to Excel (or Excel in the toolbar): "A workbook with typed cells, outlined groups and subtotal formulas."
What the PDF holds#
- One page per sheet at the paper size, with the fonts embedded and real text you can select and search.
- Charts drawn as vectors, and links you can click.
- Page labels and bookmarks, one per named run, when sheets are renumbered or named.
What the workbook holds#
The workbook is built from the tables, not from the picture of the page:
- A worksheet per table, or one per group when the group has a page name.
- Typed cells, with numbers as numbers and dates as dates, and the formats from the design.
- Caption rows merged over their columns, so a matrix is a real cross-tab.
- Groups outlined, so Excel's own collapse works, and group footers and totals as
SUBTOTALformulas.
Running-total cells are values, not formulas. A table split into a worksheet per named group has no total row: each worksheet has its group's footer instead.
Saving and sharing#
- Save (Ctrl+S) saves the report to its folder. It counts toward your plan's saved reports, and keeps the definition only: a printable report keeps no rows of its own (see Where the data comes from).
- Save as… opens Save as a variation: "A copy in the same folder, with your changes so far. You keep working on the copy; this report stays as it was last saved. Schedules aren't copied." Click Save copy.
- Undo and redo cover every change in the designer, and the report's history is the same as a dashboard's.
- A printable report is shared like any other report, with the same access levels, guests and public links (see Sharing). A viewer, a guest or a public link opens the preview with the parameter bar, PDF and Excel.
Scheduled delivery#
Schedule in the toolbar sends the report on a schedule, as a link or a file. It is shown to editors once the report is saved. The dialog has two tabs, Schedules and Deliveries.
Plan availability: scheduled delivery needs Ultimate. Every send keeps a snapshot of the data, which only Ultimate stores.
Setting up a schedule#
- Click New schedule. The name starts as "report weekly".
- Set Send: Every day, Every week (tick the days under On), Every month (on day 1 to 31), Every few hours (every 60 to 10,080 minutes), or Only by hand. Set the time (at) and the Time zone.
- Under Recipients, type Addresses, one per line. Each address is checked as you leave the box: member, guest or no access, with the reason. "n addresses can't open this report and will be skipped. Share the report with them first (Share on the report's page)."
- Under Parameters, give each parameter a Value for everyone, or leave it blank for its default.
- Under How it's sent, choose As: A link (the default), An attached file or Both. For a file, choose PDF, Excel or Both.
- Set the email's Subject and Message, and Keep for (30 days by default): how long each send's snapshot and files are kept.
- Leave On ticked, and click Save schedule.
The Schedules tab lists each schedule with when it sends, how many addresses, how it's sent, Next and Last. Send now sends it at once ("It goes out within a minute."), Edit changes it and Delete removes it.
- A send that was missed (while the service was down, say) isn't caught up: the schedule moves on to its next time.
- Each recipient gets one email per send, with every file of that send.
- A schedule acts as the person who set it up. If they can no longer edit in the workspace, the schedule is paused.
Recipients from a dataset#
For a list that changes, such as one manager per department, use From a dataset: pick a dataset and its Email field…. Every row becomes a recipient. The Parameters table then has a third column, Or each row's field: pick a field to give each recipient their own value (their department, their customer number) in place of (the value for everyone).
The recipients dataset is read with the access of the person who set up the schedule. A row without an address is left out, and the same address with the same values gets one copy. Each recipient is still checked, and one without access is skipped. If a required parameter has no value for a recipient, that recipient's copy fails and is logged, rather than sending a blank report. One send goes to 1,000 recipients at most; past that, only the first 1,000 are sent to.
What each recipient sees#
"Every send keeps the data as it was at that moment, so everyone sees the same report. Each person sees only the rows their own access allows, in the link and in the file, never the rows of whoever set up the schedule."
- A link opens the report as it was sent, signed in as the recipient, with its parameters locked. From there they can save it as a PDF or export it to Excel.
- An attached file is made for each recipient with their own access, so two recipients of one send can get two different files. A file too large to attach is sent as a download link instead, with the date it works until.
- The rules aren't kept with the snapshot, only the data. If someone's access changes after a send, opening the link shows the data as it was sent, under their new access. An attached file stays as it was made.
- A link that has expired, or whose data is no longer kept, says "This delivery isn't available to you, or it has expired." or "The data this delivery was sent with is no longer kept."
The Deliveries tab#
Deliveries lists every send, one row per recipient: Sent, To, As (link, PDF or XLSX) and Status (queued, rendered, sent, skipped or failed, with the reason). Open opens the snapshot that was sent, and Download saves the attached file while it is kept ("That file isn't available any more." after that). "Nothing sent yet." shows until the first send.
Reports that can't be scheduled#
A printable report that reads a spreadsheet held in memory can't be scheduled: there would be no rows to send. New schedule, Save schedule (for a schedule that is on) and Send now say so, for example "Sales is a spreadsheet held in memory while the report is open, so this report can't be scheduled. Load it into a workspace dataset to schedule it." You can still turn a schedule off or delete it.
Where the data comes from#
A printable report keeps no rows of its own. Every dataset is read when the report opens or runs:
- A workspace dataset with stored rows is read from the workspace, with the reader's own row access.
- A live or replay dataset is read when the report runs, with the values its parameters send.
- A spreadsheet held in memory is read in your browser and never uploaded, on Mini (and on Try it and the Free plan). Saving keeps its columns only. When you open the report again, the Data pane and the preview say Pick Sales.xlsx again; nothing shows from it until you do, and a run without it fails with "no rows: the spreadsheet isn't loaded". On Plus and Ultimate a spreadsheet is uploaded as a workspace dataset instead. See Spreadsheets held in memory.
If a saved printable report opens on a dataset that keeps only its columns (and isn't held in memory), the page says This report needs stored rows and lists those datasets.
Starting from an .rdl file#
An SSRS report (.rdl, with its subreports, shared datasets .rsd and shared data sources .rds, or a .zip of them) converts to a printable report: "Converts the report's layout, parameters and datasets, then lets you bind its datasets and lists what to finish by hand."
- On the Reports page, Upload report and pick the file, then pick the workspace dataset each of its datasets reads (see Uploading a report). On Mini, the datasets keep their columns only.
- Or in New report, choose Printable report, then Start from From an SSRS report (.rdl), and drop the file on the box ("Drop the .rdl file here, or browse"). An
.rdldropped on New report's spreadsheet drop area starts a printable report from it too.
The Conversion notes list what to set up, what was left out and what was approximated. When a converted dataset is bound to a live dataset, its query parameters are sent from the report's parameters, so the report reads per parameter value as it did before.
Printable reports in the desktop app#
The desktop app has the same designer, with no account: choose Printable report in New report, design it, preview it, save it as a PDF or export it to Excel, and save it as an .ifpr file. It converts .rdl files the same way, offline. Schedule isn't there: publish the report to an Ultimate workspace to schedule it. See Printable reports on this computer and Converting an SSRS report.
A draft from Ask FastPass#
A report or page answer from Ask FastPass has Save as a printable report ("A paginated draft for PDF, Excel and scheduled delivery"). It saves the answer as a new printable report: pages become sheets, charts the designer's charts, grids and matrices tables, slicers parameters, and the visuals it couldn't convert are named.
Limits to know#
- Fonts are the fonts that come with Insight FastPass, in Latin characters. Fonts installed on your computer can't be used, and other scripts show as missing characters.
- Text runs left to right, with no kerning or ligatures. Right-to-left and complex scripts aren't handled.
- Charts are the designer's own seven types, not the dashboard's charts.
- Pictures from a web address must be public https addresses, at most 2 MB each, fetched within 10 seconds, and up to 200 addresses per render. A picture that fails shows a crossed box. A scheduled send keeps the data as of the send, not the pictures.
- Barcodes: Code 128 takes letters, digits and punctuation (printable ASCII).
- All but the last and All but the first and last headers and footers keep their room on the last sheet.
- Bands nest three levels deep at most.
Plan limits summary#
| Feature | Try it | Free | Mini | Plus | Ultimate |
|---|---|---|---|---|---|
| Design, preview, the six templates | Yes | Yes | Yes | Yes | Yes |
| Save as PDF, Export to Excel | Yes | Yes | Yes | Yes | Yes |
| Save to the workspace | No | No | Yes | Yes | Yes |
| Save as a variation | No | No | Yes | Yes | Yes |
| Spreadsheets | Held in memory | Held in memory | Held in memory | Uploaded as a dataset | Uploaded as a dataset |
Upload an .rdl | No | No | Yes, columns only | Yes | Yes |
| Scheduled delivery | No | No | No | No | Yes |
| Save as a printable report from Ask FastPass | No | No | No | No | Yes |
Desktop app, no account: design, PDF, Excel, .rdl, .ifpr files | Yes | Yes | Yes | Yes | Yes |