
Docs › Start here
In-app tutorials (guided tours)
Insight FastPass has short guided tours that run over the real screens: a dimmed page with a spotlight on one control at a time and a card explaining it. This guide explains how tours are offered, how to start, pause, resume and skip them, how to switch them off, and what each tour covers.
How tours work#
A tour is a few short steps. Each step highlights one part of the screen (a button, a menu, a panel) and shows a card beside it with a title and a sentence or two of explanation. A few steps ask you to actually do something, such as dragging a visual onto the page, and move on by themselves once you have.
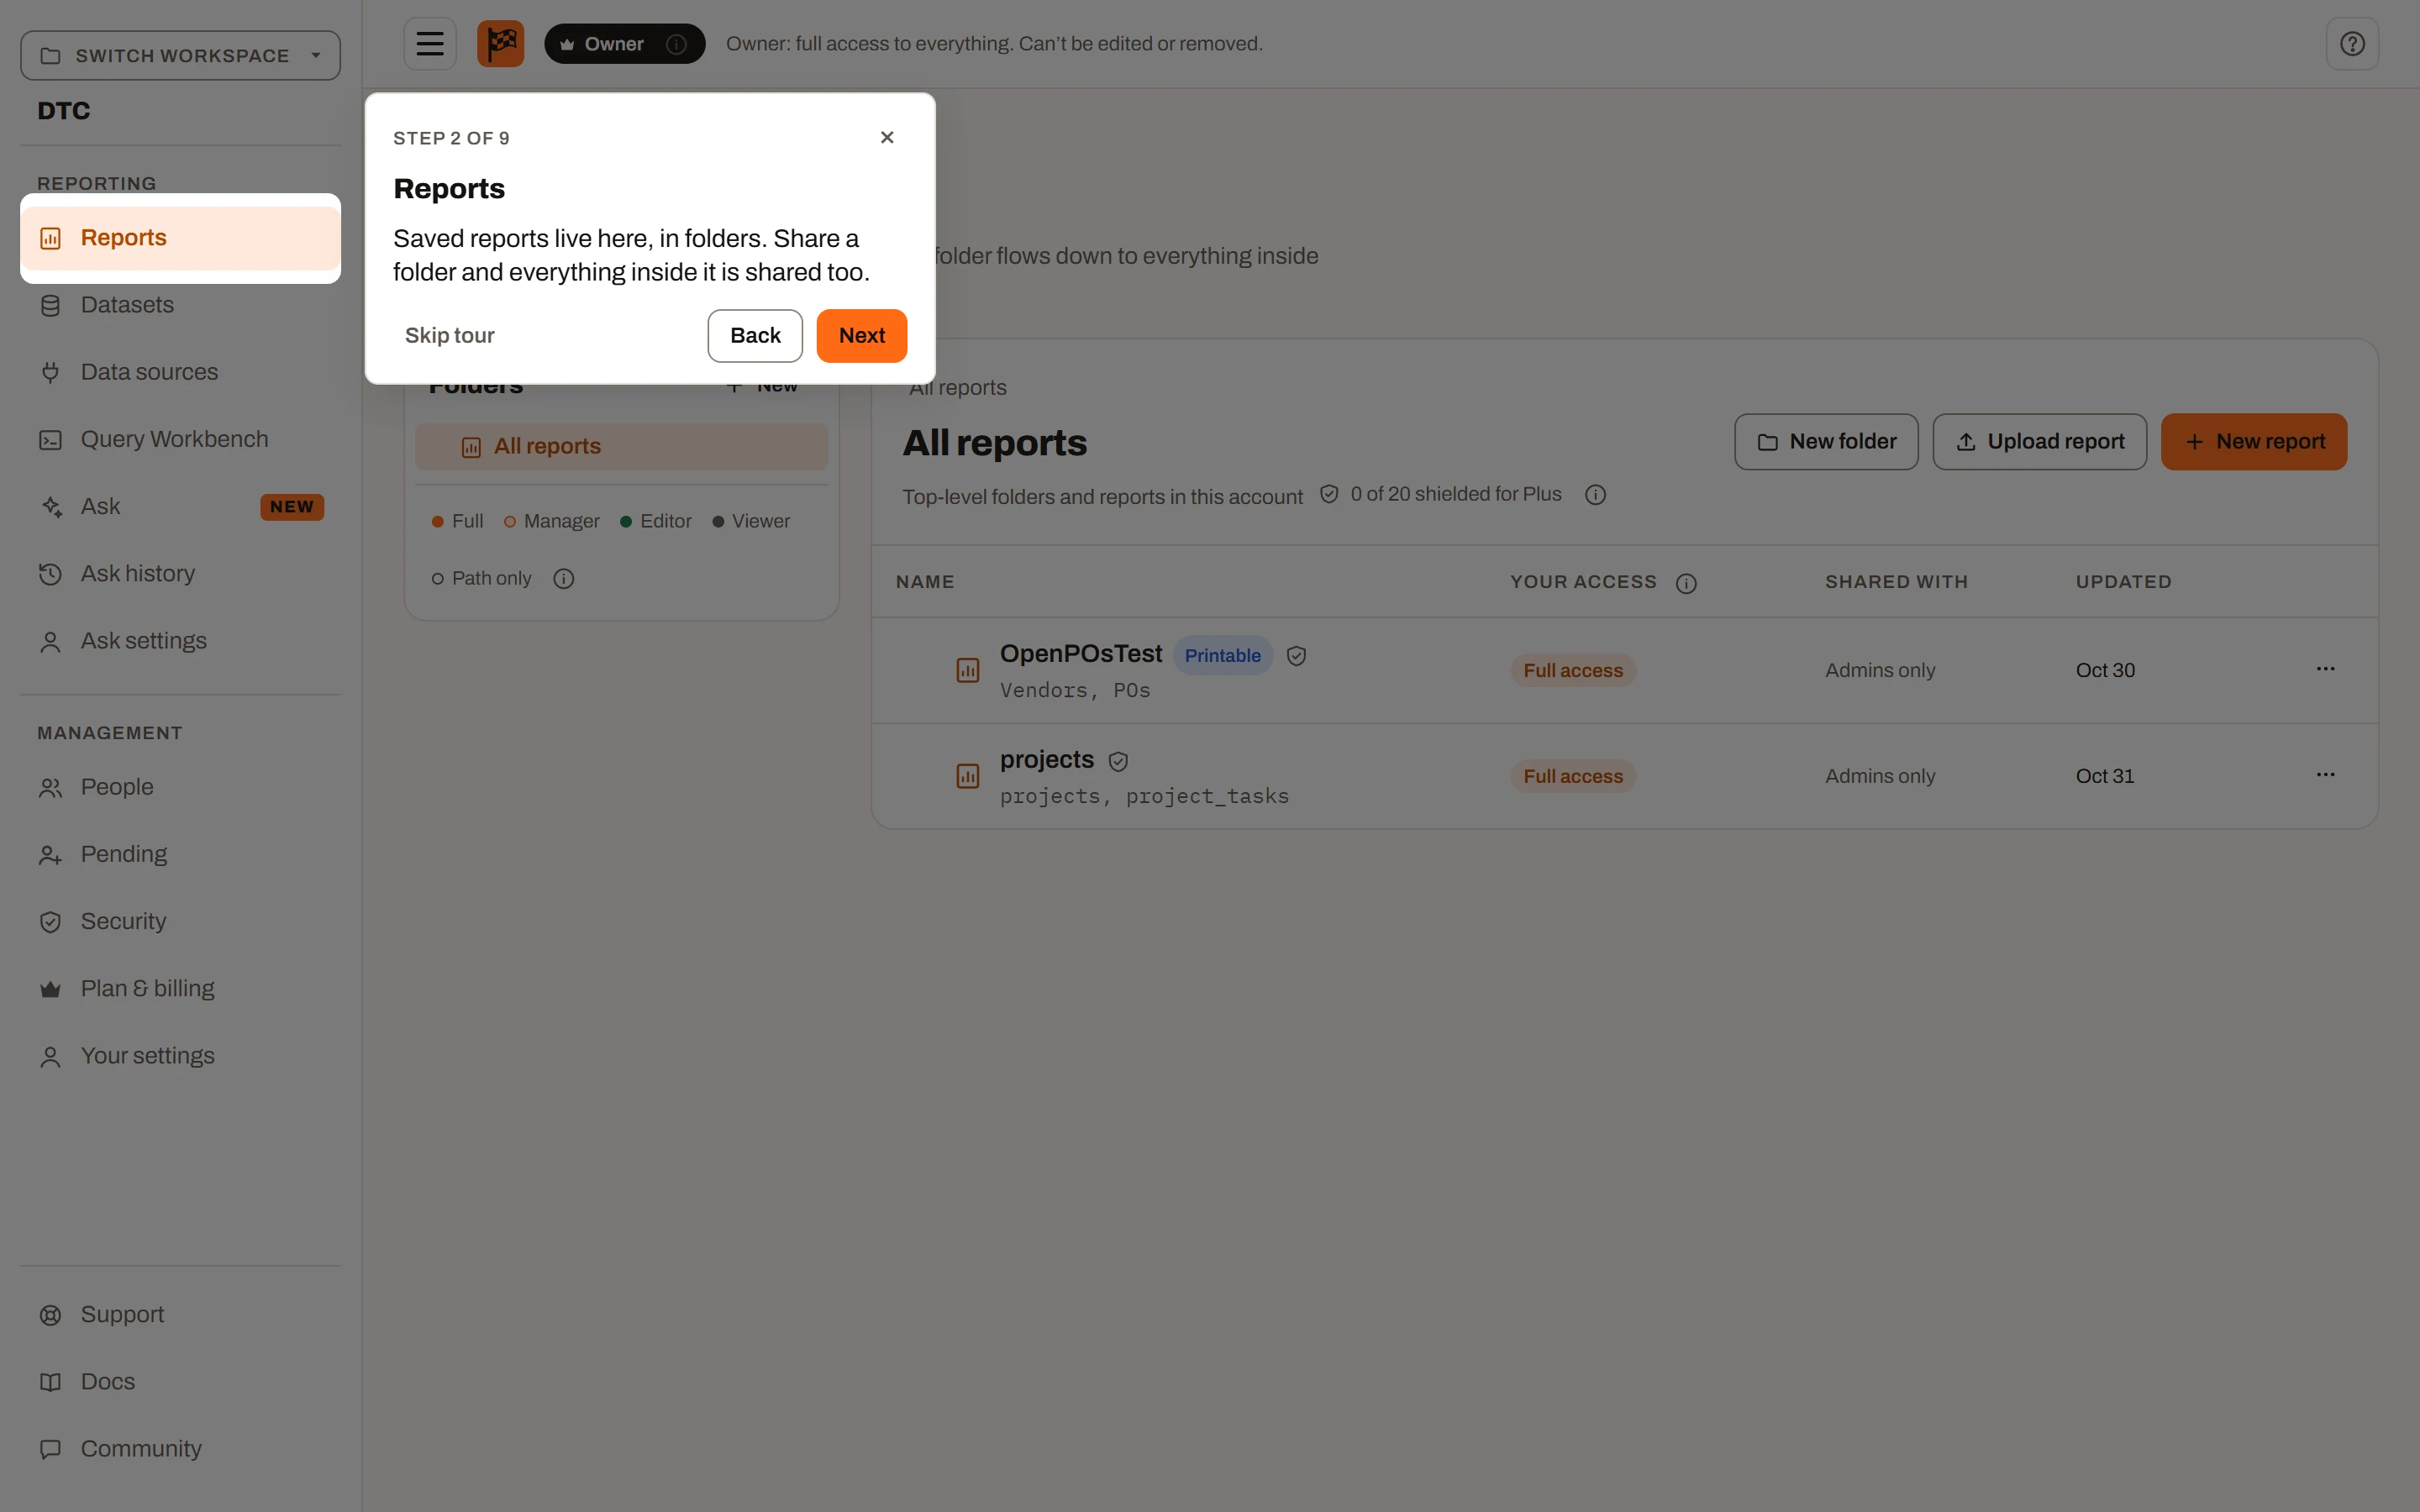
A guided tour: the spotlight on the workspace switcher, and the card explaining it.
Tours are only for signed-in users. They run in the workspace area, in the report builder for saved reports, and in the Free plan's New report builder. They do not run on the anonymous Try it free page, on public report links, or on the public website.
How it works: your progress (which tours you have finished, skipped or paused, and on which step) is saved to your account, so it follows you to any browser or device you sign in on. If you finish a tour in one browser tab, other open tabs catch up when you switch back to them.
Tours match your role and plan#
What you are shown always depends on the workspace that is open:
- Plan: a tour only covers what the open workspace's plan includes. A whole tour for a higher plan (for example Datasets, which starts at Plus) isn't listed or offered at all. Steps about higher-plan features are left out of the tour and its step count, so you are never walked through something you can't use. Some steps add an extra sentence on plans that include more (for example, sharing details from Plus).
- Role: steps about actions your role can't take are left out (for example, viewers don't see the New folder step), and some tours are only for certain roles (see Every tour).
- Screen: steps are skipped when the thing they point at isn't on screen, for example workspace-only sections while you are in Shared Reports.
So the same tour can have a different number of steps for different people, or for you in different workspaces.
Desktop only#
Tours need a screen (or browser window) at least 900 pixels wide. Below that, nothing tutorial-related appears: no welcome, no offers, no ? button. The Tutorials panel on Your settings says "Tutorials run on a larger screen. Open this page on a desktop to take one." and its Start buttons are greyed out.
If you make the window narrower while a tour is running, the tour pauses and remembers its step; widen the window and resume it. The first-login welcome is not used up on a small screen, so it still appears on your first desktop visit.
The first-login welcome#
The first time you open the workspace area on a large enough screen, a Welcome dialog appears: "Welcome, your name. Want a two-minute tour?" It explains that tours point out where things are (your workspaces, reports and datasets, and the report builder), that each is a few short steps over the real screen, and that you can leave any tour with Escape and pick it up later.
| Button | What happens |
|---|---|
| Take the tour | Starts Around your workspace straight away. |
| Not now | Closes the dialog. The tour is not offered again during this visit, but will be offered (as a small card) next time. Pressing Escape does the same. |
| Hide tutorials | Switches tutorials off. Nothing is offered automatically from then on. |
Whichever you choose, the welcome never appears again. The note at the bottom says tutorials can be turned back on, and any tour replayed, under Your settings › Tutorials.
The welcome only appears on the workspace's own pages (Reports, Datasets, People, Pending, Upgrade, Your settings), not in the report builder.
Tour offers (the small card)#
When a tour is due on the screen you are on, a small card appears in the bottom corner of the screen. It never blocks the page. It shows the tour's title, how many minutes it takes and a one-line summary, with:
- Start tour (or Resume with "Pick up where you left off." if you paused it earlier);
- Later: hides the offer for the rest of this visit (until you reload the page or sign in again);
- Hide tutorials: switches tutorials off everywhere.
A tour is due when you are on its screen, it's included in the workspace's plan and your role, and you haven't finished or skipped it. Some tours wait for the right moment: the builder tour waits until a report is open for editing, and Working with data waits until the report uses at least two datasets. Only one offer shows at a time; the first due tour (in the order listed under Every tour) comes first.
Nothing is offered while a tour or the welcome is on screen, or while tutorials are hidden.
The card is also used for two other messages:
- "What's new on plan", described in What's new after an upgrade.
- A tour waiting for its screen: if you start a tour that needs a screen the app can't open for you, the card tells you what to do, for example "Open a report, or start one with New report, and the tour picks up in the builder." or "Drop a spreadsheet on this page and the tour picks up in the builder." Do that within about two minutes and the tour starts. Click OK to stop waiting; the tour will then be offered when you reach that screen yourself.
The ? button#
A ? button sits at the right of the workspace's top bar and in the report builder's toolbar. Click it to open the tutorials menu:
- Tours for this screen: every tour that belongs on the screen you are on, for your role and the workspace's plan, even ones whose moment hasn't come yet. Each shows its status:
- "N min": not started. Click to start.
- "Resume · step X of Y": paused. Click to continue.
- "Done · replay": finished. Click to run it again from the start.
- "Skipped · start again": skipped. Click to run it again from the start.
- If none belongs here: "No tour for this screen yet."
- All tutorials ("Replay, restart or reset any tour"): opens Your settings.
- Show tutorials: the same on/off switch as on Your settings.
Starting a tour from this menu works even when tutorials are switched off.
Taking a tour#
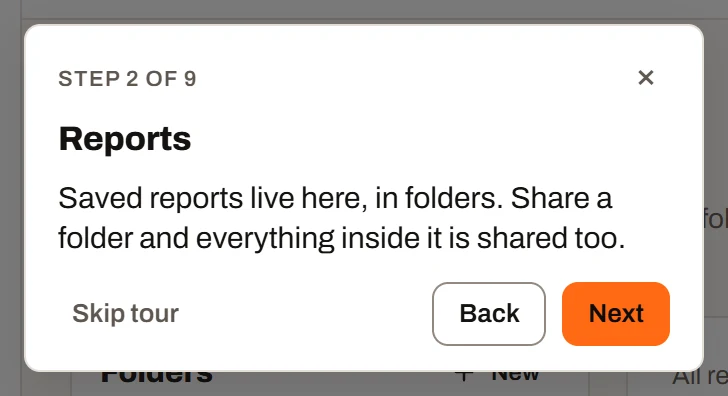
A tour card: the step counter, Skip tour, Back and Next.
Each step's card shows:
- Step X of Y at the top (with "What's new on plan ·" in front during a What's new tour);
- a × ("Leave the tour for now") at the top right;
- the step's title and explanation;
- Skip tour at the bottom left;
- Back (from the second step on) and Next, which reads Done on the last step.
While a step is showing, the rest of the page is dimmed and can't be clicked, apart from in directed steps (below). The page scrolls to bring the highlighted control into view. If a highlighted control hasn't appeared after about two seconds, the card shows in the middle of the screen instead. Some steps open the right panel for you first (for example the builder's Data or Visuals tab).
Directed steps#
A few steps ask you to do something:
| Tour | Step | What to do |
|---|---|---|
| The report builder | Add a visual | Drag any card from the visual gallery onto the page ("Drop a visual on the page to continue.") |
| The report builder | Point it at your data | Add a field to one of the selected visual's wells, or change one that is there ("Add or change a field in one of the wells to continue.") |
| Sharing a report | Open a report's sharing | Open Share & permissions from any folder's or report's menu ("Open Share & permissions on any folder or report.") |
During these steps the card shows the instruction with a pulsing dot instead of Next, and you can click the page normally. The tour moves on by itself as soon as you have done it. If you can't or don't want to, Skip this step appears after 20 seconds and moves on without it.
Pausing and resuming#
You can leave a tour at any point without losing your place:
- press Escape, or click × on the card;
- navigate away from the tour's screen (a link, the Back button);
- close the report builder during a builder tour;
- make the window narrower than 900 pixels.
The tour is paused on the step you were on. Resume it from the offer card (Resume), the ? menu, or Your settings. It picks up at the same step. The exception is Sharing a report, which always restarts from its first step, because its later steps are inside the sharing dialog that the first step asks you to open.
Skipping a tour#
Skip tour ends the tour and marks it as skipped. A skipped tour is not offered again automatically, but stays in the ? menu ("Skipped · start again") and on Your settings, where you can start it again from the beginning at any time.
Finishing a tour#
Done on the last step marks the tour as finished, with the date. It isn't offered again unless the tour is updated: when a tour's content changes significantly, people who finished the older version are offered it again, and Your settings labels it "Updated since you took it".
Starting a tour from elsewhere#
If you start a tour from Your settings or the ? menu while you're on a different screen, the app takes you to the tour's screen first and starts it there. For the builder tours on plans that save reports, the app can't open a report for you, so it takes you to Reports and the offer card tells you to open or start a report.
Hiding tutorials#
You can switch tutorials off from the welcome (Hide tutorials), any offer card (Hide tutorials), the ? menu (untick Show tutorials), or Your settings (untick Show tutorials).
While tutorials are hidden:
- the welcome, the offer cards and the "What's new" offers don't appear;
- a tour that is running closes;
- the list of tours on Your settings is closed and its arrow is greyed out;
- the ? button is still there, and you can still start any tour from it.
Turn them back on with Show tutorials on Your settings or in the ? menu. Your progress is kept while tutorials are hidden.
What's new after an upgrade#
When a workspace moves to a higher plan, the tour steps you missed because they were for a higher plan become available. Insight FastPass collects them into one short tour called "What's new on plan", for example "What's new on Plus".
How it works: when you take a tour, any steps left out because the workspace's plan didn't include them are quietly noted against your account, along with the plan you were on. Later, whenever the open workspace is on a plan that includes those steps, they are offered as "What's new". This happens whether the workspace was upgraded, you were given ownership of a higher-plan workspace, or you simply switched to a workspace on a higher plan.
- The offer card reads "What's new on plan", "N things unlocked in tour names.", with See what's new and Later.
- See what's new runs the unlocked steps of each tour in turn, in their usual order, moving between screens as needed. Steps that belong in the report builder wait until you open a report.
- Later puts the offer off for this visit. Skip tour during a What's new tour does the same.
- Once a step has been shown, it is no longer "new".
- On Your settings, the Tutorials list shows a What's new on plan row ("N features … are on this workspace's plan now") with Replay what's new. If some of it belongs in the builder, it adds "The tour name part shows when you next open a report."
Only steps from tours you have actually taken are collected. A whole tour that was above your plan (for example Datasets on Free) isn't part of What's new; it simply starts being offered as a normal tour on its own screen once the plan includes it.
The Tutorials panel on Your settings#
The Tutorials panel on Your settings is where to find every tour again: "Short guided tours over the real screens: where things are, how the report builder works, and what a plan adds. Replay any of them here."
- Show tutorials: the on/off switch. "Off hides every offer (the welcome, the tour cards and the plan notes) and closes the list of tours."
- The arrow beside it opens the list of tours (it starts closed, and can't be opened while tutorials are off).
The list has one row per tour available to you in the open workspace (for your role and its plan), with the tour's title, a status tag, its summary and its length in minutes:
| Status tag | Buttons |
|---|---|
| Not started | Start, Mark as done |
| Step X of Y | Resume, Restart, Mark as done |
| Done date | Restart |
| Skipped | Restart, Mark as done |
| Updated since you took it | Start, Restart, Mark as done |
- Start / Resume run the tour, opening its screen first if needed.
- Restart runs the tour again from step 1.
- Mark as done records the tour as finished without taking it, so it isn't offered.
- Reset all progress… asks "Forget every tour's progress, so each one is offered again from the start? The Show tutorials switch stays as it is." Click Reset all progress to confirm, or Cancel. This also clears the record of steps you missed on lower plans, so What's new starts empty.
Start, Resume, Restart and Replay what's new are greyed out on screens narrower than 900 pixels.
Tutorial progress is personal to you, not to a workspace. Deleting your account deletes it; a new account with the same email starts the tours fresh.
Every tour, step by step#
The tours are listed in the order they are offered. "Plan" is the lowest plan the open workspace must be on. Steps marked with a plan or role only appear for those plans or roles; unmarked steps appear for everyone the tour is for.
Roles: "editors and up" means Owner, Admin, Manager and Editor. Guests (people with reports shared with them by email) never get tours.
Around your workspace#
The switcher, the sections on the left, your role and where to find help. About 2 minutes. Plan: all plans. For: everyone. Offered on: the Reports page (and started by Take the tour on the welcome).
- Your workspaces: the switcher. A workspace holds its own reports, datasets and people on its own plan. Switch workspaces here, open Shared Reports for anything sent to you by email, or create a new workspace.
- Reports (Free only): start a report here. New report opens the builder on a spreadsheet; on this plan a report lasts for the session.
- Reports (Mini and up): saved reports live here, in folders. On Plus and Ultimate, sharing a folder shares everything inside it.
- Datasets (Plus and up, in a workspace): the spreadsheets your reports read. Upload once, build any number of reports, replace it next month and every report shows the new rows.
- People (in a workspace): who is in the workspace and what each person may do. From Mini, owners and admins invite people here.
- Plans (in a workspace): the Upgrade section, showing what each plan includes.
- Your role (in a workspace): the role chip in the top bar sets the most you can do. On Plus and Ultimate, folder and report sharing decide where it applies.
- Notifications: invitations to workspaces and workspaces offered to you wait here, with a count, until you answer.
- Your settings: your workspaces, your password, and the Tutorials panel.
- Help is a click away: the ? button lists the tours for the current screen; leave any tour with Escape and pick it up later.
- Build your first report (editors and up, in a workspace): New report opens the builder; drop a spreadsheet and a first dashboard appears. The builder has its own tour.
On Free this tour has 9 steps for an owner; on Plus and Ultimate, 10. In Shared Reports only the switcher, Reports, Notifications, Your settings and help steps appear.
Saved reports#
Folders and the actions on each report. About 2 minutes. Plan: Mini and up. For: everyone. Offered on: the Reports page, in a workspace.
- Folders: folders nest as deep as you like; pick one to see what's in it, and All reports is the top level. On Plus and Ultimate, access set on a folder covers everything in it.
- New folder (editors and up): make a folder for a team or a period. On Plus and Ultimate, share it once instead of sharing each report.
- Upload report (editors and up): upload a report saved from this app, an
.ifprfrom the desktop app, an SSRS.rdlor a Power BI template (.pbit). The Import from Power BI guide shows how to save one. - New report (editors and up): starts a report in the open folder. Pick the datasets it reads, or drop a file, and the builder opens.
- Each report's menu: click a report to open it; its menu renames, moves, duplicates or deletes it, and greys out what your access doesn't allow. On Plus and Ultimate it also shares the report with people in the workspace, and on Ultimate it switches its public link.
- Shared with you (Plus and Ultimate): everything shared with you personally in this workspace, wherever it's filed.
See Saved reports.
The report builder#
Add a visual, point it at your data, lay out the page, filter it and save. About 4 minutes. Plan: all plans. For: editors and up. Offered in: the report builder, once a report is open for editing (on Free, after you drop a spreadsheet on the New report page).
- Name your report: click the name and type; the label beside it shows whether there are unsaved changes. The name can be changed while the step is up.
- Pick a theme: preset themes, or your own colours and chart palette, applied to every page. The theme button works during the step, and its panel is lit when it opens, with the card moved clear of it.
- Your data: the Data tab lists every sheet and its columns with the type read for each. Click a field to edit its name, alias, type and format in the Visual pane; double-click it to add it to the selected visual, or drag it onto a visual or into a well.
- The visual gallery: every visual your plan includes. Search by name.
- Every chart type (Mini and up): line, area and combo charts, scatter plots, histograms and box plots, treemaps, funnels, gauges, heat maps, region maps, Gantt charts and the matrix: 33 visuals in all.
- Add a visual (directed): drag a card from the gallery onto the page. It snaps to the grid. The page is lit as well as the gallery, and scrolled to the bottom so there is free space to drop on.
- Point it at your data (directed): the selected visual's settings show its wells, which say which columns it reads. Add a field to a well, or swap one that is already there. The Data pane is lit as well, so fields can be dragged from it.
- Move and resize: drag a visual by its header to move it and its corner to resize it; Ctrl-click several visuals, or drag a box on the page area, to select them all at once; dragging, Delete and copy then apply to every selected visual. The page stays live during this step, so you can try it before pressing Next.
- Pages and templates: + Page adds a blank page or a page template matched to your data; type in a tab to rename it, drag to reorder. On Plus and up the dashboard templates are there too. + Page works during the step; while its dialog is open the tour steps aside, and it comes back when the dialog closes.
- Filters: the Filters tab of the Visual pane. Filter any text or date column for all pages, this page, or the selected visual; the Filter visual puts the page's choice on the page for readers. The tab and the pane under it are lit and can be used during the step.
- Drill-through: build a detail page that shows a breakdown of some other data in the report. In that page's Filters pane, under This page, select the target button on a filter to make the page eligible for drill-through. Right-clicking a visual on another page with related data then shows Drill to your detail page, which opens the detail page filtered by what you right-clicked. The step clears any selection on the page, so This page shows unfolded in the Filters tab, and the pane can be used during the step.
- Edit, Dash view and Full screen: Dash view is what readers see; its lock stops visuals being dragged. Full screen also hides the toolbar and fills the screen; Esc leaves it. The three buttons work during the step. In Full screen the tour is hidden until you leave it, and Esc there leaves Full screen without pausing the tour. The next step (or Back) returns the builder to Edit.
- Undo, history, redo: every change is a step, and the history list jumps back to any point.
- Print: print or save to PDF, choosing pages, paper and fit.
- Save and export (Mini and up): Save keeps the report in your workspace (Ctrl+S works too); Export downloads its definition to import elsewhere.
On Free this tour has 13 steps; on Mini, 14; on Plus and Ultimate, 15. See The report builder, Visual types and Filters and interactions.
Working with data#
Connect sheets, edit rows in the grid and export them. About 2 minutes. Plan: Mini and up. For: editors and up. Offered in: the report builder, when the report uses at least two datasets (it can be started from the ? menu at any time in the builder).
- Connect your sheets: two sheets that share a column (an order id, a customer) can be connected so a filter on one filters the other. One-to-many is fine; many-to-many gets a warning.
- Edit and export the rows: points at Export data in the Data pane. A Grid visual lets you fix values, add rows and delete them once Editing is switched on in its settings; Export data gives the dataset back as a spreadsheet with those edits.
- Export a package (Plus and Ultimate): Export › Download report (.ifpr) downloads the report with its data and edits inside.
See Datasets and Snapshots and versions.
Datasets#
Upload once, replace or add snapshots, saved data and connections. About 2 minutes. Plan: Plus and up. For: everyone. Offered on: the Datasets page.
- Upload once, use everywhere (editors and up): drop a spreadsheet or CSV here and every report in the workspace can read it.
- Replace, don't rebuild: Replace swaps in a newer file with the same columns; every report using it shows the new rows next time it opens.
- Saved data: a saved dataset opens in the grid and reports read it without asking for the file. Plus saves up to 10 datasets and Ultimate up to 50; the upload box shows how many are in use.
- Edits and row access: edit a saved dataset's rows and Save changes (Plus and Ultimate), and switch on row access filtering (Plus and Ultimate) to decide who sees which rows.
- Add a snapshot (Ultimate, editors and up): Add or replace › Add as snapshot keeps every row and adds the file's, dated by the snapshot column. The Snapshots list offers Remove and Replace per date, date and time settings, a lock on older snapshots and a thinning rule. In a report, visuals show the latest snapshot, and the Data pane's Load the last… loads only recent ones.
- Connections: link datasets on shared columns, and every report built on them starts connected.
See Datasets and Snapshots and versions.
People and roles#
Invite people, set roles and see what each role allows. About 2 minutes. Plan: Mini and up. For: owners and admins. Offered on: the People page.
- Invite people: invite by email, with or without an account. They join when they accept; until then the invitation waits on Pending. On Plus and Ultimate you can already share folders and reports with them.
- Roles: a role is the most someone can do. Admins do everything; managers can make reports public where they manage them; editors work in what's shared with them; viewers read.
- Groups (Plus and Ultimate): put people in a group to assign row access to all of them together.
- Roles & access: the full reference of what each role allows (on Plus and Ultimate, including each kind of sharing).
See User management.
Sharing a report#
Who has access, inherited access, and on Ultimate guests by email and the public link. About 2 minutes. Plan: Plus and Ultimate (the last two steps are Ultimate's). For: owners, admins and managers. Offered on: the Reports page, in a workspace. Always resumes from step 1.
- Open a report's sharing (directed): open a folder's or report's menu (the three dots at the end of its row) and pick Share & permissions.
- Who has access: the people and groups given access and how much (view, edit or manage). A grant is capped by the person's role, and you can't give more than you hold.
- Inherited access: access from the folders above flows down; change it here to override it for this item.
- Share by email (reports only, Ultimate): send a report to anyone outside the workspace. They can only view it, take no seat, and the share can have an end date.
- The public link (reports only, Ultimate): every report has one permanent link. Switch it public, give it an end date or reset it, and hand out tracked copies to see who opened it.
Steps 4 and 5 appear only when the dialog is open on a report, not a folder. See Sharing.
Your settings#
Your workspaces, tutorials and the ways out. About 1 minute. Plan: all plans. For: everyone. Offered on: Your settings.
- Your workspaces: switch, rename or create a workspace, or transfer one you own. Each is a separate subscription with its own reports, datasets and people.
- Tutorials: switch tutorials on or off; the arrow opens every tour to replay or restart.
- Signing out: log out of this browser, change your password, or sign out of every browser at once.
- Deleting your account: removes your sign-in; transfer any workspace that should carry on first.
See Your settings.
Plan limits summary#
| Tour | Free | Mini | Plus | Ultimate | Who |
|---|---|---|---|---|---|
| Around your workspace | 9 steps | 9 steps | 10 steps | 10 steps | Everyone |
| Saved reports | Not available | 5 steps | 6 steps | 6 steps | Everyone (fewer steps for viewers) |
| The report builder | 13 steps | 15 steps | 15 steps | 15 steps | Editors and up |
| Working with data | Not available | 2 steps | 3 steps | 3 steps | Editors and up |
| Datasets | Not available | Not available | 5 steps | 6 steps | Everyone (fewer steps for viewers) |
| People and roles | Not available | 3 steps | 4 steps | 4 steps | Owners and admins |
| Sharing a report | Not available | Not available | 3 steps | 5 steps | Owners, admins, managers |
| Your settings | 4 steps | 4 steps | 4 steps | 4 steps | Everyone |
| What's new on plan | Not applicable | When steps unlock | When steps unlock | When steps unlock | Everyone |
Step counts are for an owner in a workspace; other roles and screens can see fewer. The plan is always the open workspace's, and tours are enforced only in the app (they are guidance, not a security control).