
Docs › Build reports
Formulas
Formulas let you work out new values from your data. Three features share one formula language:
| Feature | Where you find it | What it gives you |
|---|---|---|
| Calculated field | Data tab → a dataset → Calculated field | A new column, worked out for each row. |
| Summary Calculation | Data tab → Summary Calculations → New or Import… | One value per bar, slice, point or KPI, worked out over a group of rows. |
| Conditional styling rule | Select a grid → Conditional styling → a rule set to Formula | A TRUE / FALSE test per row that decides whether a cell or row is coloured. See Conditional styling in the grid. |
The language, the functions and the rules about blanks are the same everywhere. What changes is which rows a formula can see, covered in Where a formula runs.
Ask FastPass can propose calculated fields and Summary Calculations from a description of what you want, checked against your data, for you to review and save.
1. Writing a formula#
Fields#
| You write | It means |
|---|---|
[Qty] | The Qty column of the formula's own dataset. |
Customers[Region] or Customers.Region | The Region column of the linked Customers dataset. The dot form works when the column name is one word; Customers.[Region name] works for one with spaces. |
'Order Lines'[Qty] | The same, for a dataset whose name has spaces or symbols. Put the name in single quotes. |
Sales.Orders.Qty or Sales.Orders[Unit price] | A column of the Orders dataset in the Sales folder. 'Sales.Orders'[Qty] means the same. |
- Field and dataset names ignore case:
[qty]findsQty. If two columns differ only by case, the exact match wins. - A field name can hold spaces and symbols, because the square brackets mark where it starts and ends:
[Unit Price ($)]. - A calculated field can read other calculated fields as if they were sheet columns.
- A Summary Calculation or styling rule can name another Summary Calculation by its name in brackets:
[Gross Margin]. - A bare word without brackets is treated as a function name. If you forget the brackets, the editor tells you: Put field names in square brackets.
- Dot notation names a dataset's column:
Products.UnitPriceisProducts[UnitPrice]. Use it with the formula's own dataset (Products.UnitPricein a calculated field on Products is its own column) or a linked one. A column name with spaces still needs brackets:Products.[Unit price]. For a dataset in a folder, put the folder first:Sales.Orders.Qty. The last dot separates the dataset from the column, so more than three parts, or an empty one, is an error: "X" isn't a field. Write Dataset.Field or Folder.Dataset.Field, or Dataset[Field name] for a name with spaces. - The formula's own dataset answers to its name with or without its folder (
Sales.Orders.QtyorOrders.Qty). In a report, a dataset added asSales.Ordersalso answers toOrderswhen no other dataset in the report has that name. - You don't have to type field names. Drag a field from the Data pane onto the formula box and it fills the next gap in the formula, or type
[and pick one from the suggestions. See The formula editor.
Values you type in#
| Kind | Examples | Notes |
|---|---|---|
| Number | 12, 1.5, .25, 1e6 | |
| Text | "Open", 'Open' | Double quotes are safest. To include a quote inside the text, double it: "He said ""hi""". |
| True / false | TRUE, FALSE | You can also write them as TRUE() and FALSE(). |
| Blank | BLANK() | An empty value. |
| Date | DATE(2026, 3, 1) or DATEVALUE("2026-03-01") | There is no date literal. Text that looks like a date is also read as one wherever a date is expected, so [Due] < "2026-03-01" works. |
Operators#
Operators are listed from the one that binds tightest to the one that binds loosest. Use parentheses whenever you want to be sure of the order.
| Operator | Meaning | Example |
|---|---|---|
^ | Power | [Side] ^ 2 |
- (in front) | Negative | -[Amount] |
* / | Multiply, divide | [Qty] * [Price] |
+ - | Add, subtract | [Revenue] - [Cost] |
& | Join text | [First] & " " & [Last] |
= <> < <= > >= | Compare. == is the same as =, and != the same as <>. | [Status] = "Open" |
NOT | Not | NOT [Closed] |
AND | Both | [Qty] > 10 AND [Region] = "West" |
OR | Either | [Priority] = "High" OR [Late] |
AND, OR and NOT can also be called as functions: AND(a, b, c).
Other syntax rules#
- Function names ignore case:
sum([Qty])is the same asSUM([Qty]). - You can separate arguments with commas or semicolons.
- Spaces and new lines are ignored, so you can lay a long formula out over several lines.
2. Types and conversions#
Every value is a number, text, a date, true/false, or blank. The editor shows the result type as a chip under the formula.
- Numbers in text cells are read as numbers.
"$1,200"reads as 1200, and"15%"reads as 15 (not 0.15). Spaces,$,,and%are ignored. - Dates are compared as dates: earlier is smaller. Date text such as
"2026-03-01"or"Mar 1, 2026"is read as a date wherever a date is needed. - True/false reads as 1 or 0 in arithmetic. When a number or text is used as a test (in
IF,ANDand so on):- Blank,
0,FALSE, and the text"false"or"0"count as false. - Everything else counts as true.
- Blank,
- Text comparisons ignore case and the spaces at either end.
[Status] = "open"matchesOpenandOPEN. - A number compared with text is compared as numbers when the text reads as one:
[Code] = 42matches the text"42".
3. Blanks#
A blank is an empty cell, BLANK(), or a lookup that found nothing.
| Situation | Result |
|---|---|
Arithmetic with a blank: [A] + [B] where [B] is empty | Blank |
| Dividing by zero, or by a blank | Blank. You never get an error or "infinity". |
Joining text: "ID-" & [Code] with [Code] empty | "ID-" (the blank joins as nothing) |
[A] = BLANK() | TRUE when [A] is blank |
[A] = "x" when [A] is blank | FALSE |
[A] <> "x" when [A] is blank | TRUE, because blank is "not x" |
[A] > 5, [A] < 5 and other ordering when [A] is blank | FALSE |
| A blank used as a test | False |
Aggregates (SUM, AVERAGE, MIN …) | Blanks are skipped |
SUM over no rows at all | 0 |
AVERAGE, MEDIAN, MIN or MAX over no values | Blank |
To give a blank a default value, use COALESCE([Discount], 0) or IFNULL([Discount], 0).
4. Where a formula runs#
Each feature runs formulas in a different setting, which decides what a formula can see.
| Calculated field | Summary Calculation | Styling rule | |
|---|---|---|---|
| Worked out | Once per row of its dataset | Once per bar, slice, point or KPI | Once per row the grid shows |
[Field] on its own | ✅ This row's value | ❌ Must be inside an aggregate such as SUM([Field]) | ✅ This row's value |
Aggregate over its own dataset, e.g. AVERAGE([Sales]) | ❌ | ✅ Over the rows in this bar or KPI | ✅ Over every row the grid shows |
Parent lookup: Customers[Region] | ✅ | ✅ Inside an aggregate only: SUM([Qty] * Products[Price]) | ✅ |
Child aggregate: SUM(Lines[Qty]) | ✅ | ❌ (see the workaround in section 5) | ✅ |
Other Summary Calculations: [Margin %] | ❌ | ✅ | ✅ Worked out over every row the grid shows |
Functions that look across rows: RANK, RUNNINGTOTAL, PREVIOUS, PERCENTOFTOTAL | ❌ | ✅ Across the visual's categories | ✅ Across the grid's rows |
Which rows are in scope#
- Summary Calculation in a chart: the rows behind each bar, slice or point. These are the rows left after the page filters, cross-filters from other visuals, the visual's own "Show only rows where" conditions, and the latest snapshot.
- Summary Calculation in a KPI, gauge or total: every row the visual shows, with the same filters applied.
- Styling rule: every row the grid shows, with the same filters applied. This includes rows scrolled out of view, but sorting a column by clicking its header does not change the scope.
- Linked rows (parent lookups and child aggregates) always come from every row of the linked dataset inside the report's snapshot window. Page filters on the linked dataset don't narrow them. A calculated field therefore has the same value on every page.
5. Reading linked datasets#
Datasets are linked in the Connections tab. Once two datasets are connected, a formula on one can read the other. The direction of the link decides how.
Parent rows (the "one" side)#
When each row of your dataset matches one row of the other (an order has one customer), write Dataset[Field]:
Customers[Region]
Customers[Credit Limit] - [Order Total]
IF(Customers[Tier] = "Gold", [Price] * 0.9, [Price])- The row is found through the connection's key fields. If no row matches, the value is blank.
- A one-to-one connection works the same way.
- In a Summary Calculation, a parent lookup must be inside an aggregate, because the lookup needs a row:
SUM([Qty] * Products[Unit Price]).
Child rows (the "many" side)#
When each row of your dataset matches many rows of the other (an order has many lines), the other dataset can only be read through an aggregate:
SUM(Lines[Qty])
SUM(Lines[Qty] * Lines[Price])
COUNT(Lines[LineId])
MAX(Lines[Ship Date])
AVERAGE(Lines[Discount])- The aggregate reads only the child rows linked to the current row. An order with no lines gives
SUM= 0, andMAXorAVERAGE= blank. - Inside the aggregate you can also read the current row's own columns:
SUM(IF(Lines[Qty] > [Min Order Qty], 1, 0)). - One aggregate can read only one child dataset, and can't read a parent dataset at the same time. Use separate aggregates:
SUM(Lines[Qty]) + SUM(Returns[Qty]). SUM(Lines[Qty])on its own row means "the lines of this order". It is allowed in calculated fields and styling rules, but not in Summary Calculations.
Errors you may see#
| Message | Fix |
|---|---|
| X isn't connected to Y. Link them in the Connections tab | Add a connection between the two datasets. |
| There is no dataset named "X" in this report | Check the spelling, or add the dataset to the report. |
| X[Field] has many rows per Y row. Use it inside SUM, COUNT, … | Wrap it in an aggregate. |
| … can only read one linked dataset at a time | Split it into one aggregate per child dataset. |
| Inside SUM over X, only X and Y columns can be read | Move the parent lookup out of the child aggregate. |
6. Function reference#
Each function lists its arguments. In "What it does", an argument is named in double quotes ("count" characters of "text"), the same way the editor's Insert function… list describes it. Optional arguments are explained there too.
The editor's tooltip for each function also shows a worked example, such as MID("something", 4, 5) = "ethin".
Conditional#
| Function | What it does | Example |
|---|---|---|
IF(test, then, else) | Gives "then" when "test" is true, otherwise "else". Without "else", the result is blank. | IF([Qty] >= 100, "Bulk", "Standard") |
CASE(test1, value1, test2, value2, …, default) | Gives the "value" next to the first "test" that is true. Gives "default" (or blank) when none is. | CASE([Days Late] > 30, "Critical", [Days Late] > 7, "Late", "On time") |
SWITCH(value, match1, result1, …, default) | Gives the "result" next to the first "match" that equals "value". Gives "default" (or blank) when none does. Text matches ignore case. | SWITCH([Region], "N", "North", "S", "South", "Other") |
IF, CASE, SWITCH, COALESCE, IFNULL, AND and OR only work out the arguments they need. This means IF([Qty] = 0, 0, [Total] / [Qty]) never divides by zero.
Blanks#
| Function | What it does | Example |
|---|---|---|
COALESCE(value1, value2, …) | Gives the first of the values that isn't blank. | COALESCE([Nickname], [First Name], "Unknown") |
IFNULL(value, fallback) | Gives "value", or "fallback" when "value" is blank. | IFNULL([Discount], 0) |
ISBLANK(value) | Gives TRUE when "value" is blank. | ISBLANK([Ship Date]) |
BLANK() | Gives a blank value. | IF([Qty] = 0, BLANK(), [Total] / [Qty]) |
True / false#
| Function | What it does |
|---|---|
AND(test1, test2, …) | TRUE when every test is true. |
OR(test1, test2, …) | TRUE when any test is true. |
NOT(test) | TRUE when "test" is false. |
TRUE(), FALSE() | True and false. |
Math#
| Function | What it does | Example → result |
|---|---|---|
+ - * / ^ | Arithmetic. Dividing by zero gives blank. | [Revenue] / [Units] |
ABS(number) | "number" without its sign. | ABS(-4) → 4 |
ROUND(number, decimals) | Rounds "number" to "decimals" decimal places, half away from zero. "decimals" defaults to 0, and a negative value rounds to tens, hundreds and so on. | ROUND(1.005, 2) → 1.01, ROUND(1234, -2) → 1200 |
CEILING(number, step) | Rounds "number" up to the next multiple of "step" (default 1). | CEILING(7, 5) → 10 |
FLOOR(number, step) | Rounds "number" down to the previous multiple of "step" (default 1). | FLOOR(7, 5) → 5 |
MOD(number, divisor) | The remainder after dividing "number" by "divisor", with the sign of "divisor". | MOD(10, 3) → 1 |
SQRT(number) | The square root of "number". | SQRT(16) → 4 |
POWER(number, exponent) | "number" raised to the power "exponent". Same as ^. | POWER(2, 3) → 8 |
DIVIDE(numerator, denominator, fallback) | "numerator" ÷ "denominator", or "fallback" (default blank) when "denominator" is 0 or blank. | DIVIDE([Won], [Total], 0) |
Text#
| Function | What it does | Example → result |
|---|---|---|
CONCAT(text1, text2, …) | Joins the texts. A blank joins as nothing. Same as &. | CONCAT([City], ", ", [State]) |
LEFT(text, count) | The first "count" characters of "text" (default 1). | LEFT("ABC-123", 3) → "ABC" |
RIGHT(text, count) | The last "count" characters of "text" (default 1). | RIGHT("ABC-123", 3) → "123" |
MID(text, start, count) | "count" characters of "text", from position "start", where 1 is the first character. Without "count", gives the rest of "text". | MID("ABC-123", 5, 2) → "12" |
LEN(text) | How many characters "text" has. A blank has 0. | LEN("Hello") → 5 |
TRIM(text) | "text" without spaces at either end, and with runs of spaces turned into one. | TRIM(" a b ") → "a b" |
UPPER(text), LOWER(text) | "text" in capitals, or in lower case. | UPPER([Code]) |
CONTAINS(text, part) | TRUE when "text" holds "part" (ignores case). | CONTAINS([Notes], "urgent") |
STARTSWITH(text, part) | TRUE when "text" starts with "part" (ignores case). | STARTSWITH([SKU], "HW-") |
ENDSWITH(text, part) | TRUE when "text" ends with "part" (ignores case). | ENDSWITH([Email], "@acme.com") |
REPLACE(text, find, with) | "text" with every "find" replaced by "with". This one is case-sensitive. | REPLACE([Phone], "-", "") |
TEXT(value, format) | Turns "value", a number or date, into text, using "format". See below. | TEXT([Amount], "currency") |
VALUE(text) | Reads "text" as a number. | VALUE("1,200") → 1200 |
TEXT formats. The second argument can be one of the following:
- A number of decimals:
TEXT([Rate], 2)gives "3.14". - A format name:
"number": separators and 1 decimal."integer""compact": 1.2K, 3.4M."currency","currencyCompact","currencyMillions""percent","percent0""text"
"percent" adds a % sign to the number as it is. To show 0.15 as 15%, write TEXT([Rate] * 100, "percent"). A date is shown the way the report shows dates.
Dates#
| Function | What it does | Example |
|---|---|---|
TODAY() | Today's date. It stays the same for one refresh, so every row agrees. | [Due] < TODAY() |
NOW() | The current date and time. | |
DATE(year, month, day) | Builds a date from "year", "month" and "day". Values out of range roll over, so DATE(2026, 13, 1) is 1 Jan 2027. | DATE(YEAR([Ordered]), 12, 31) |
DATEVALUE(text) | Reads "text" as a date. | DATEVALUE("Mar 1, 2026") |
YEAR(date), MONTH(date), DAY(date) | Parts of "date". | MONTH([Ordered]) → 1 to 12 |
QUARTER(date) | The quarter of "date", 1 to 4. | |
WEEK(date) | The ISO week number of "date", 1 to 53. Weeks start on Monday. | |
WEEKDAY(date) | The day of the week of "date", 1 (Sunday) to 7 (Saturday). | Weekend: WEEKDAY([Ordered]) = 1 OR WEEKDAY([Ordered]) = 7 |
HOUR(date) | The hour of "date", 0 to 23. | |
DATEDIFF(start, end, unit) | Whole "unit"s from "start" to "end". Negative when "end" is earlier. | DATEDIFF([Ordered], [Shipped], "day") |
DATEADD(date, count, unit) | "date" moved by "count" "unit"s. A negative "count" goes back. | DATEADD([Ordered], 30, "day") |
EOMONTH(date, months) | The last day of the month, "months" months after "date" (default 0). | EOMONTH([Invoice Date], 0) |
STARTOFMONTH(date) | The first day of the month "date" falls in. |
Units for DATEDIFF and DATEADD:
| Unit | Short forms |
|---|---|
"day" | "d" |
"week" | "w", "wk" |
"month" | "m" |
"quarter" | "q" |
"year" | "y" |
Plurals such as "days" also work.
DATEDIFFcounts boundaries crossed for months, quarters and years, as SQL does. 31 Jan to 1 Feb is 1 month, and 1 Jan to 31 Jan is 0 months. Weeks are whole 7-day spans.DATEADDby months keeps the day where it can, otherwise it uses the month's last day. 31 Jan + 1 month gives 28 Feb (29 in a leap year).- To subtract, use a negative count:
DATEADD(TODAY(), -90, "day").
Aggregates#
An aggregate works its argument out for every row it reads and then combines the results. SUM([Qty] * [Price]) multiplies on each row and then adds up, so you never need a helper column.
| Function | What it does |
|---|---|
SUM(expression) | The total of "expression". 0 when there are no rows. |
AVERAGE(expression) (or AVG) | The mean of "expression" over the rows that hold a number. |
MIN(expression), MAX(expression) | The smallest and largest value of "expression". Also works on dates (earliest and latest) and text. |
COUNT(expression) | How many rows have a non-blank value for "expression". |
COUNT() / COUNTROWS() | How many rows there are. |
DISTINCTCOUNT(expression) | How many different non-blank values "expression" takes. Ignores case and the spaces at either end. |
MEDIAN(expression) | The middle value of "expression". |
PERCENTILE(expression, p) | The value of "expression" "p" of the way up, where "p" is from 0 to 1 (0.9 is the 90th percentile). Interpolates between neighbours, like Excel's PERCENTILE.INC. |
STDEV(expression) | The sample standard deviation of "expression". Blank with fewer than 2 values. |
- You can't put one aggregate inside another:
SUM(MAX([x]))is refused. COUNT([Flag] = TRUE)counts every row, because FALSE is not blank. To count matches, writeSUM(IF([Flag], 1, 0)).
Functions that look across rows#
These functions compare a value with the same value in the other categories (in a Summary Calculation) or in the other rows (in a styling rule). They can't be used in calculated fields, inside an aggregate, or inside each other. An aggregate can go inside them: RANK(SUM([Sales])).
| Function | What it does |
|---|---|
RUNNINGTOTAL(expression, order) | The total of "expression" so far, including this one, in axis order or by "order". |
PREVIOUS(expression, order) | "expression" for the previous category or row. Blank for the first. |
RANK(expression, "desc") | The rank of "expression": 1 for the largest. Pass "asc" to make 1 the smallest. Ties share a rank, and the next rank follows on without a gap (1, 2, 2, 3). A blank value has a blank rank. |
PERCENTOFTOTAL(expression) | "expression" as a percentage (0–100) of the total across all categories or rows. |
What "previous" and "so far" mean:
- In a Summary Calculation, the units are the visual's categories in the order the axis shows them: bars left to right, or months in date order.
- In a KPI, gauge or card, there is only one unit.
RANKis 1,PERCENTOFTOTALis 100, andPREVIOUSis blank. - In a styling rule, the units are the grid's rows. Their order is the order the rows arrive from the dataset, not the column you clicked to sort the grid. For
RUNNINGTOTALandPREVIOUSin a rule, always give theorderargument:PREVIOUS([Balance], [Statement Date]). - The optional
orderargument sorts the units by that value, from smallest to largest, with blanks last. In a Summary Calculation, this is usually an aggregate:RUNNINGTOTAL(SUM([Sales]), MIN([Order Date])).
7. Calculated fields in detail#
Create one: in the Data tab, open a dataset and click Calculated field. Give it a name and write the formula: type it (suggestions appear as you type), drag fields in from the Data pane, or use Insert field… and Insert function…. With Auto-save on (the default), it is added as soon as the name and formula check clean; with it off, click Add field. It appears in the field list with an ƒ glyph, and you can use it anywhere a column can go: wells, filters, slicers, grids and styling rules. New visuals include it too: a new grid lists it as a column.
Edit it: click the field (or the pencil beside it) to open its panel. The panel opens at the top of the Visual pane on the right, above the selected visual's settings, titled with the field it is editing, and the field's row in the Data pane is highlighted. Calculated fields, column settings and Summary Calculations share this one panel: clicking another switches it over (asking first if the open one has unsaved changes). Change the name or formula there. Auto-save saves it as you go; with Auto-save off, click Save, and closing the panel with unsaved changes asks first. Click Remove to delete it. To put it into the selected visual, double-click it, press Ctrl+Enter on it, or drag it there.
- It belongs to the dataset, not the report. Every report that uses the dataset gets the column. Editing it in one report changes it in all of them. (Other reports that are already open pick up the change the next time they are opened.) Saving it needs edit permission on the dataset. In the try-it-out page there is no workspace, so the field is saved in that report only.
- The type is worked out from the formula:
- Number formulas give a number column. You can switch it between Number and Category, just like a sheet column, with the toggle at the top right of its panel, beside its name.
- Text formulas give a text column.
- Date formulas give a date column.
- True/false formulas give a text column holding
TRUE/FALSE.
- Name rules:
- The name can't be blank.
- It can't contain
[or]. - It can't be the same as a sheet column or another calculated field. This check ignores case.
- Calculated fields can build on each other.
Net=[Gross] - [Discount]andNet + Tax=[Net] * 1.2work out in the right order automatically. Two fields that read each other are refused: X reads a field that reads it back. - Values aren't stored. They are worked out when the report opens. They aren't written to exports, and grid editing can't change them.
- A broken formula leaves the column blank and shows the problem in red under the field.
- What a calculated field can't do: total its own dataset's rows (
SUM([Sales])), or look across rows (RANK). The message is A calculated field can't SUM its own rows. Use a Summary Calculation for these.
Typical calculated fields
| Purpose | Formula |
|---|---|
| Line total | [Qty] * [Unit Price] |
| Margin % per row | DIVIDE([Revenue] - [Cost], [Revenue]) * 100 |
| Days to ship | DATEDIFF([Ordered], [Shipped], "day") |
| Still open after 30 days | ISBLANK([Closed]) AND DATEDIFF([Opened], TODAY(), "day") > 30 |
| Age band | CASE([Age] < 18, "Under 18", [Age] < 65, "18–64", "65+") |
| Order month | STARTOFMONTH([Ordered]) |
| Full name | TRIM([First] & " " & [Last]) |
| Part number without dashes | REPLACE([Part No], "-", "") |
| Customer's region (parent) | Customers[Region] |
| Order value from its lines (child) | SUM(Lines[Qty] * Lines[Price]) |
| Lines on the order | COUNT(Lines[LineId]) |
| Latest shipment | MAX(Shipments[Ship Date]) |
| Due date from the customer's terms | DATEADD([Invoice Date], Customers[Payment Terms], "day") |
8. Summary Calculations in detail#
A Summary Calculation is a named formula over a group of rows, like a measure in Power BI. It gives one value per bar, slice, point or KPI.
Create one#
In the Data tab, go to the Summary Calculations group and click New. Then fill in:
- Name, for example "Gross margin %".
- Summarises: the dataset whose rows it totals.
[Field]references read this dataset. - Formula.
- Format: how the value shows (currency, percent and so on). It is used when the visual's own format is left on Auto.
- Higher is better: colours a KPI's change. Green means up for sales, and down for costs.
With Auto-save on (the default), it is added as soon as it checks clean; with it off, click Add. The calculation is listed under Summary Calculations with an ƒΣ glyph.
Use one#
- Drag it into a Value well.
- Or, with a visual selected, double-click it (or press Ctrl+Enter on it).
To change one, click it (or the pencil beside it). Its panel opens in the same place as a calculated field's, at the top of the Visual pane, titled with the calculation it is editing. Changes save as you go, as for calculated fields.
The visual's own Sum / Average setting is ignored for a Summary Calculation, because the formula already says how to combine the rows.
Rules#
- Every column of its own dataset must be inside an aggregate:
SUM([Revenue]), not[Revenue]. - It can read parent datasets inside an aggregate:
SUM([Qty] * Products[Cost]). - It can't read child datasets. Use a calculated field on the parent first (see section 5).
- It can use another Summary Calculation on the same dataset by name:
[Revenue Total] - [Cost Total]. That calculation is worked out over the same rows. It can't be put inside an aggregate, because it is already a total.
Sharing and importing#
- Summary Calculations are stored in the workspace, not in a report. Import… lists the workspace's calculations that aren't in this report yet.
- A calculation is greyed out when it reads a dataset this report doesn't have. Its tooltip names the missing datasets. Add them to the report to import it.
- Two calculations can share a name when they read different datasets. They are then shown as
Name (Dataset1, Dataset2)in the import list, and in the Data tab when both are in one report. The tooltip lists every dataset in full. - Editing a calculation in any report changes it for every report that uses it. Other reports that are already open pick up the change the next time they are opened.
- Remove asks whether to delete the calculation from the whole workspace or only from this report. Visuals that used it lose that value.
- Creating, changing or deleting a calculation needs edit permission on every dataset it reads. Seeing and importing one needs view permission on every dataset it reads.
Recipes for the common business calculations#
| Calculation | Formula | Notes |
|---|---|---|
| Sum | SUM([Sales]) | |
| Average | AVERAGE([Days Open]) | |
| Count of rows | COUNT() | |
| Distinct count | DISTINCTCOUNT([CustomerId]) | |
| Min / max | MIN([Order Date]), MAX([Price]) | |
| Median | MEDIAN([Deal Size]) | |
| 90th percentile | PERCENTILE([Response Time], 0.9) | |
| Standard deviation | STDEV([Lead Time]) | |
| Weighted average | SUM([Price] * [Qty]) / SUM([Qty]) | |
| Ratio | SUM([Revenue]) / SUM([Cost]) | |
| Margin % | (SUM([Revenue]) - SUM([Cost])) / SUM([Revenue]) * 100 | Set the format to Percent. |
| Win rate | SUM(IF([Stage] = "Won", 1, 0)) / COUNT() * 100 | |
| Percentage of total | PERCENTOFTOTAL(SUM([Sales])) | Share of all bars in the chart. |
| Running total | RUNNINGTOTAL(SUM([Sales])) | In axis order. |
| Difference from previous | SUM([Sales]) - PREVIOUS(SUM([Sales])) | Blank for the first category. |
| Percent change | DIVIDE(SUM([Sales]) - PREVIOUS(SUM([Sales])), PREVIOUS(SUM([Sales]))) * 100 | |
| Rank | RANK(SUM([Sales])) | 1 = highest. |
| Revenue at list price (parent lookup) | SUM([Qty] * Products[List Price]) | |
| Late share | DIVIDE(SUM(IF([Shipped] > [Due], 1, 0)), COUNT()) * 100 |
Percentages: the Percent format shows the number as it is, with a % sign. Multiply a ratio by 100, so that 0.32 shows as 32%.
9. The formula editor#
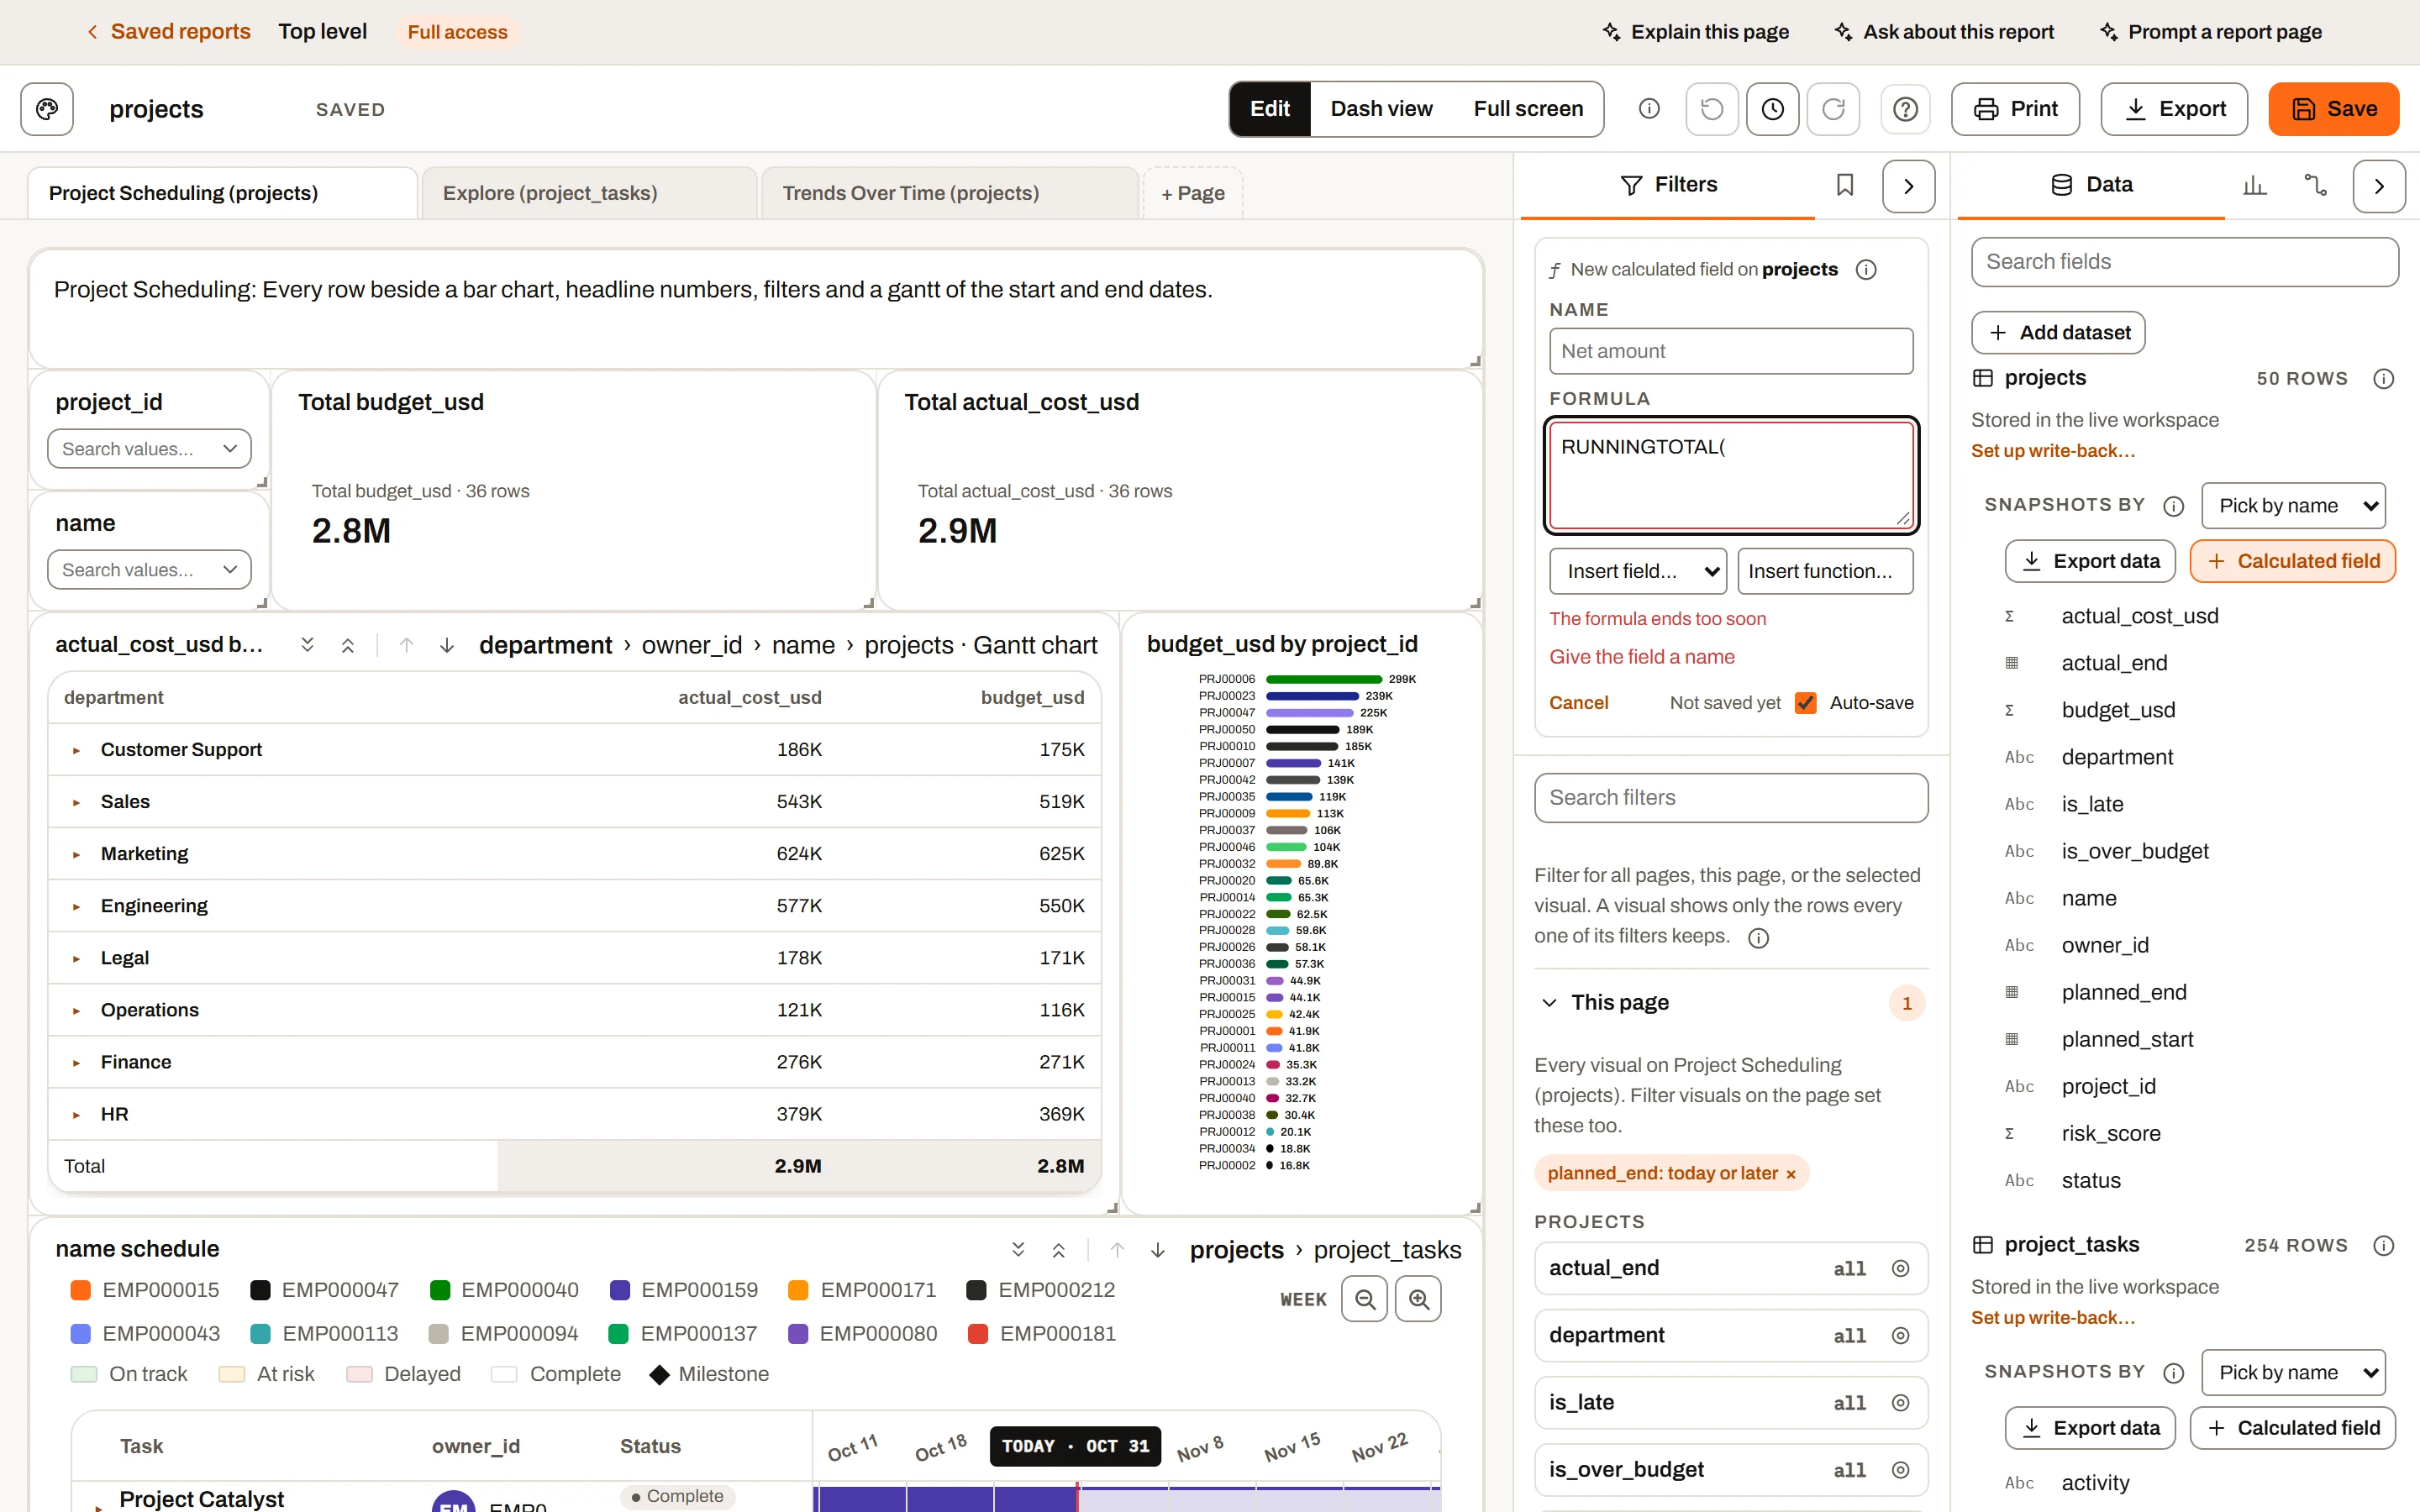
The formula editor, with the autocomplete list and the hint for the function’s arguments.
The same editor appears for calculated fields, Summary Calculations and styling rules.
- Insert field… lists every column you can reach in this setting, grouped as follows:
- The dataset's own columns.
- Summary Calculations (not shown for calculated fields).
- Each linked dataset, labelled "(one row each)" for parents or "(many rows each, use inside SUM, COUNT, …)" for children. The editor quotes dataset names that need it.
- Insert function… opens a searchable list of every function by category. Search by name or by what it does; the function you point at (or move to with the arrow keys) gets a tooltip beside it with what it does and a worked example. The suggestions you get while typing show the same tooltip. Click it, or press Enter, to insert it.
- Drag a field in. Drag a column from the Data pane onto the formula box and it goes into the next place in the formula that is missing a value, looking from where you drop it: an empty function such as
SUM(), an empty argument such asIF([Qty] > 10, , 0), or an operator with nothing after it such as[Qty] *. When nothing is missing, it goes where you drop it. A linked dataset's column is written with its dataset in front, and a Summary Calculation can be dropped wherever Insert field lists them. - Auto-save. Calculated fields and Summary Calculations save as you type, once the name and formula check clean; the panel says Saved or Not saved yet. Untick Auto-save in a panel to save with Save instead (the choice is remembered in this browser). With it off, closing a panel with unsaved changes asks before throwing them away.
- Open one again. Click a calculated field or a Summary Calculation in the Data pane to open its formula at the top of the Visual pane. To use it in the selected visual, double-click it or drag it.
- Suggestions as you type. Typing a word lists the functions and keywords (AND, OR, NOT, TRUE, FALSE) that start with it, then matching fields and linked datasets. Typing
[lists the fields, narrowed as you type; after a dataset name, only that dataset's. Use the arrow keys and Enter or Tab to pick one, Escape to close the list, or Ctrl+Space to ask for suggestions. - Live check. As you type, the editor shows either the problem under the formula (with the part of the formula at fault) or, beside the Formula label, the result type and a sample value:
- "First row: …" for calculated fields and styling rules.
- "Over all rows: …" for Summary Calculations.
- Add, Save and the rule itself only apply once the formula checks clean.
Common messages#
| Message | What it means |
|---|---|
| Enter a formula | The box is empty. |
| Unknown name "Qty". Put field names in square brackets: [Qty] | You wrote a field without brackets. |
| Orders has no column named "Qyt" | Typo, or the column is in another dataset (Other[Qyt]). |
| Unknown function FOO() | Check the name in Insert function…. |
| IF takes 2 to 3 arguments: IF(test, then, else) | Wrong number of arguments. |
| In a Summary Calculation, [Sales] must be inside SUM, AVERAGE, COUNT, MIN, MAX, … | Wrap the field in an aggregate. |
| A calculated field can't SUM its own rows | Use a Summary Calculation, or aggregate a child dataset. |
| RANK compares against the other rows of a visual | Functions that look across rows don't work in calculated fields. |
| SUM can't be used inside SUM | Aggregates can't be nested. |
| The formula ends too soon / Missing closing ) | Unbalanced brackets or a trailing operator. |
| Text is missing its closing quote | Close the ". |