
Docs › Your data
Ask FastPass
Ask FastPass answers questions about your data in plain language. You pick the datasets, type a question, and FastPass works out which totals, breakdowns and comparisons it needs, has Insight FastPass run them on the rows you are allowed to see, and writes an answer that shows its evidence. Every question is kept in Ask history.
Plan availability: Ask FastPass is part of the Ultimate plan. Anyone in the workspace can use it, viewers included, once the owner or an admin has turned it on. Each workspace has 100 questions per usage period, and the count resets on the billing date.
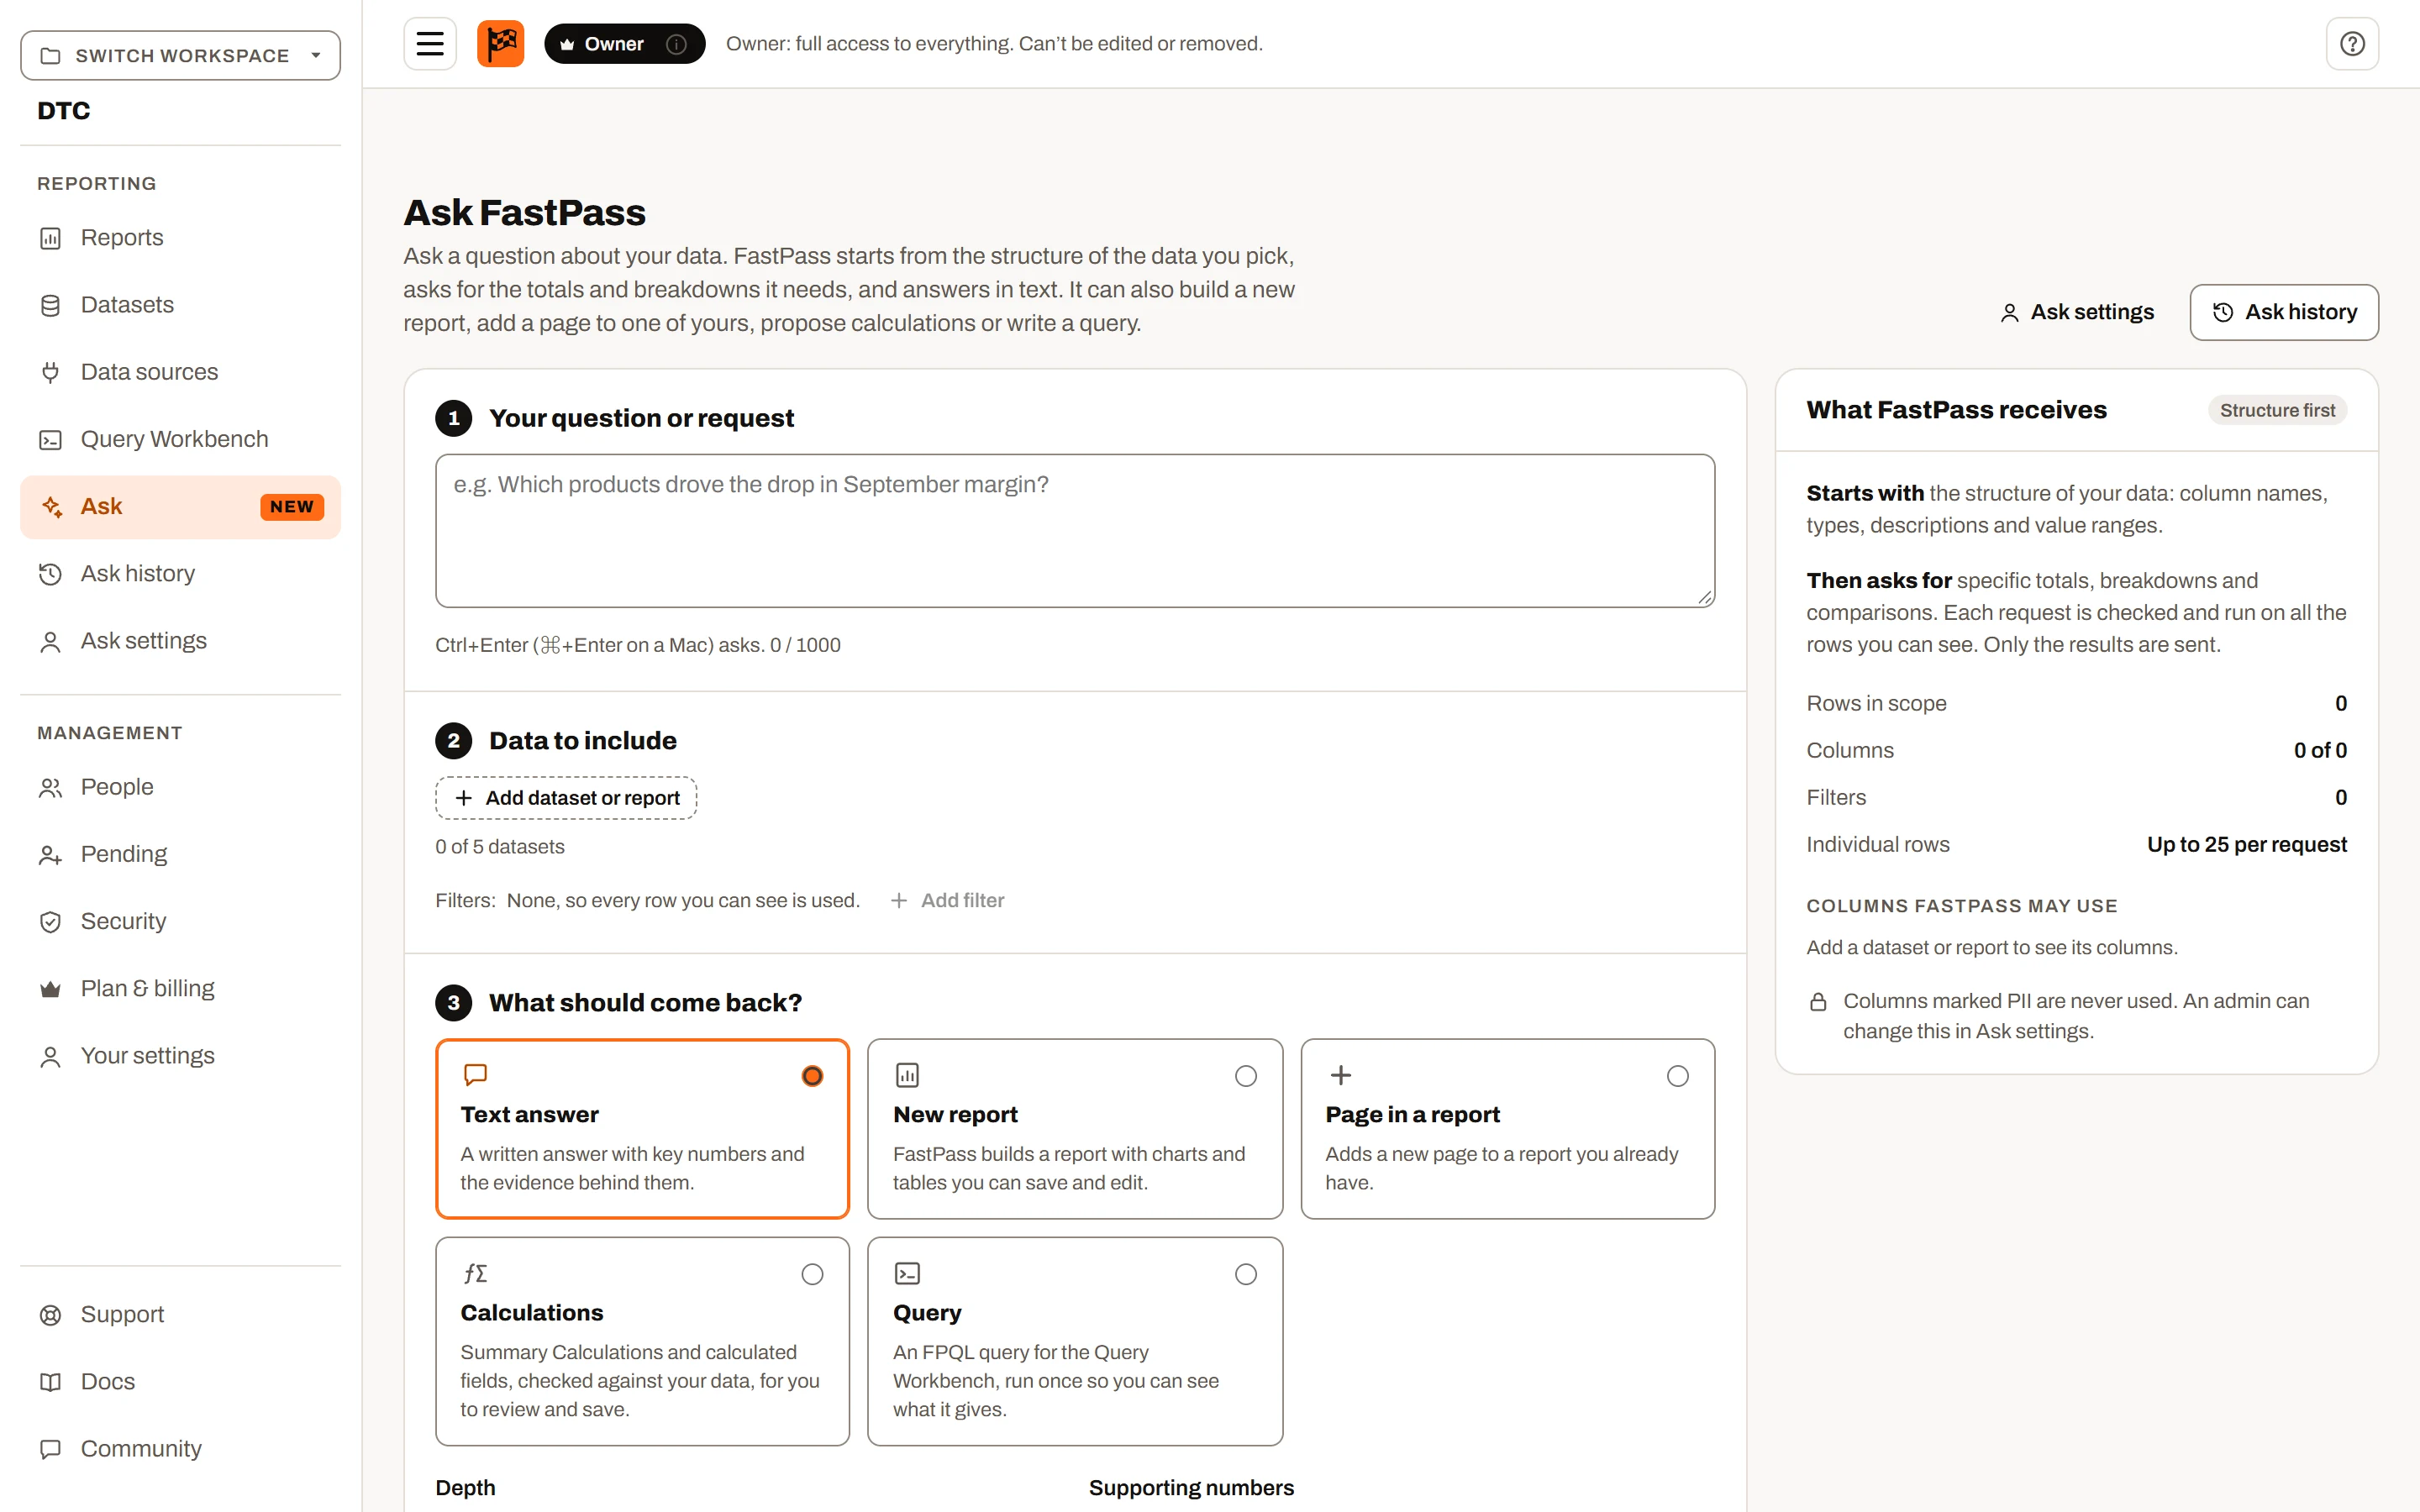
Ask FastPass: the question, the data to include and what should come back.
Turning it on#
An owner or admin turns Ask FastPass on for the whole workspace:
- Open Ask in the menu on the left, then Ask settings.
- Click Read the notice and turn on.
- Read the notice. It says exactly what is sent to OpenAI, how long OpenAI may keep it, and what Ask history keeps.
- Tick the box to confirm you are authorized to share this workspace's data with OpenAI, then click Agree and turn on Ask FastPass.
Until then, Ask says an admin needs to turn it on. If the notice's wording changes in substance, an owner or admin is asked to agree again before anyone can ask.
Turn off in Ask settings stops new questions straight away. Ask history is kept.
Asking a question#
The composer has three steps.
1. Your question or request#
Type the question in the box. Ctrl+Enter (⌘+Enter on a Mac) asks it. The Try chips under the box suggest questions from your data's columns, or follow-ups from the last answer you opened.
Good questions name what to measure and over what: "Which regions missed their Q3 pipeline target, and by how much?" works better than "How are we doing?".
2. Data to include#
- Add dataset or report lists the datasets you can open, grouped by folder and shown by their full names (
Sales.Orders), and your reports. - A report brings its datasets and the filters on its first page.
- One question can use up to 5 datasets, counted after reports are expanded.
- Add filter narrows the rows: pick a column, a comparison and, for "is one of", the values from the column itself. Filters apply to every request FastPass makes, so it can't look outside them.
3. What should come back#
| Choice | What you get |
|---|---|
| Text answer | A written answer with key numbers and the evidence behind them. Pick a depth: Quick (up to 2 rounds of checks, brief), Thorough (up to 3 rounds, detailed) or Investigate (up to 4 rounds, for "why did this change", compared with the previous period). |
| New report | FastPass designs a report with charts and tables. Give it a name (or let FastPass suggest one), choose up to 3 pages, and either see a draft first or have it saved straight to a folder when it's ready. |
| Page in a report | FastPass designs a new page for a report you can edit, after the page you pick. It is never added without your OK. |
| Calculations | Summary Calculations and calculated fields, checked against your data, for you to review and save. Choose Both, Summary Calculations or Calculated fields, and with two or more datasets which dataset calculated fields go on (or let FastPass choose). See Calculations. |
| Query | An FPQL query for the Query Workbench, run once so you can see what it gives. Give it a name or let FastPass suggest one. Shown to members who can use the Workbench (Plus or Ultimate), and not when a report is among the sources (Ask about this report): a query is asked on datasets. See Queries. |
What FastPass receives#
The panel beside the composer shows what FastPass works from:
- It starts with the structure of your data: column names, types, descriptions and value ranges.
- It then asks for specific totals, breakdowns and comparisons. Each request is checked and run on all the rows you can see. Only the results are sent.
- Rows in scope counts the rows after your filters, Columns how many it may use.
- Columns FastPass may use lists every column. Untick any you want left out. Columns marked PII (personal information such as emails and phone numbers) can't be ticked and are never used. Long text columns start unticked.
There is no switch for sending sample rows. FastPass asks for individual rows (up to 25 per request) only when a question needs them, and only if the workspace allows row-level results.
The bar at the bottom shows how many questions the workspace has used this period and when the count resets.
While FastPass works#
The result page shows the steps: reading your data's structure, planning, checking the data round by round, and writing the answer. Under Checking the data each request appears in plain words as it runs, with a tick when it is done or a note such as "Rejected: unknown value, retrying".
You can leave the page. The answer is saved to Ask history, and while the app is open a note at the bottom of the screen tells you when it is ready.
Needs your input. If the question is ambiguous, FastPass asks you. Pick one of the options it gives or type a reply, and it carries on with the same question. A reply doesn't count as another question.
Cancel stops it. The question stays in Ask history as Cancelled.
Reading the answer#
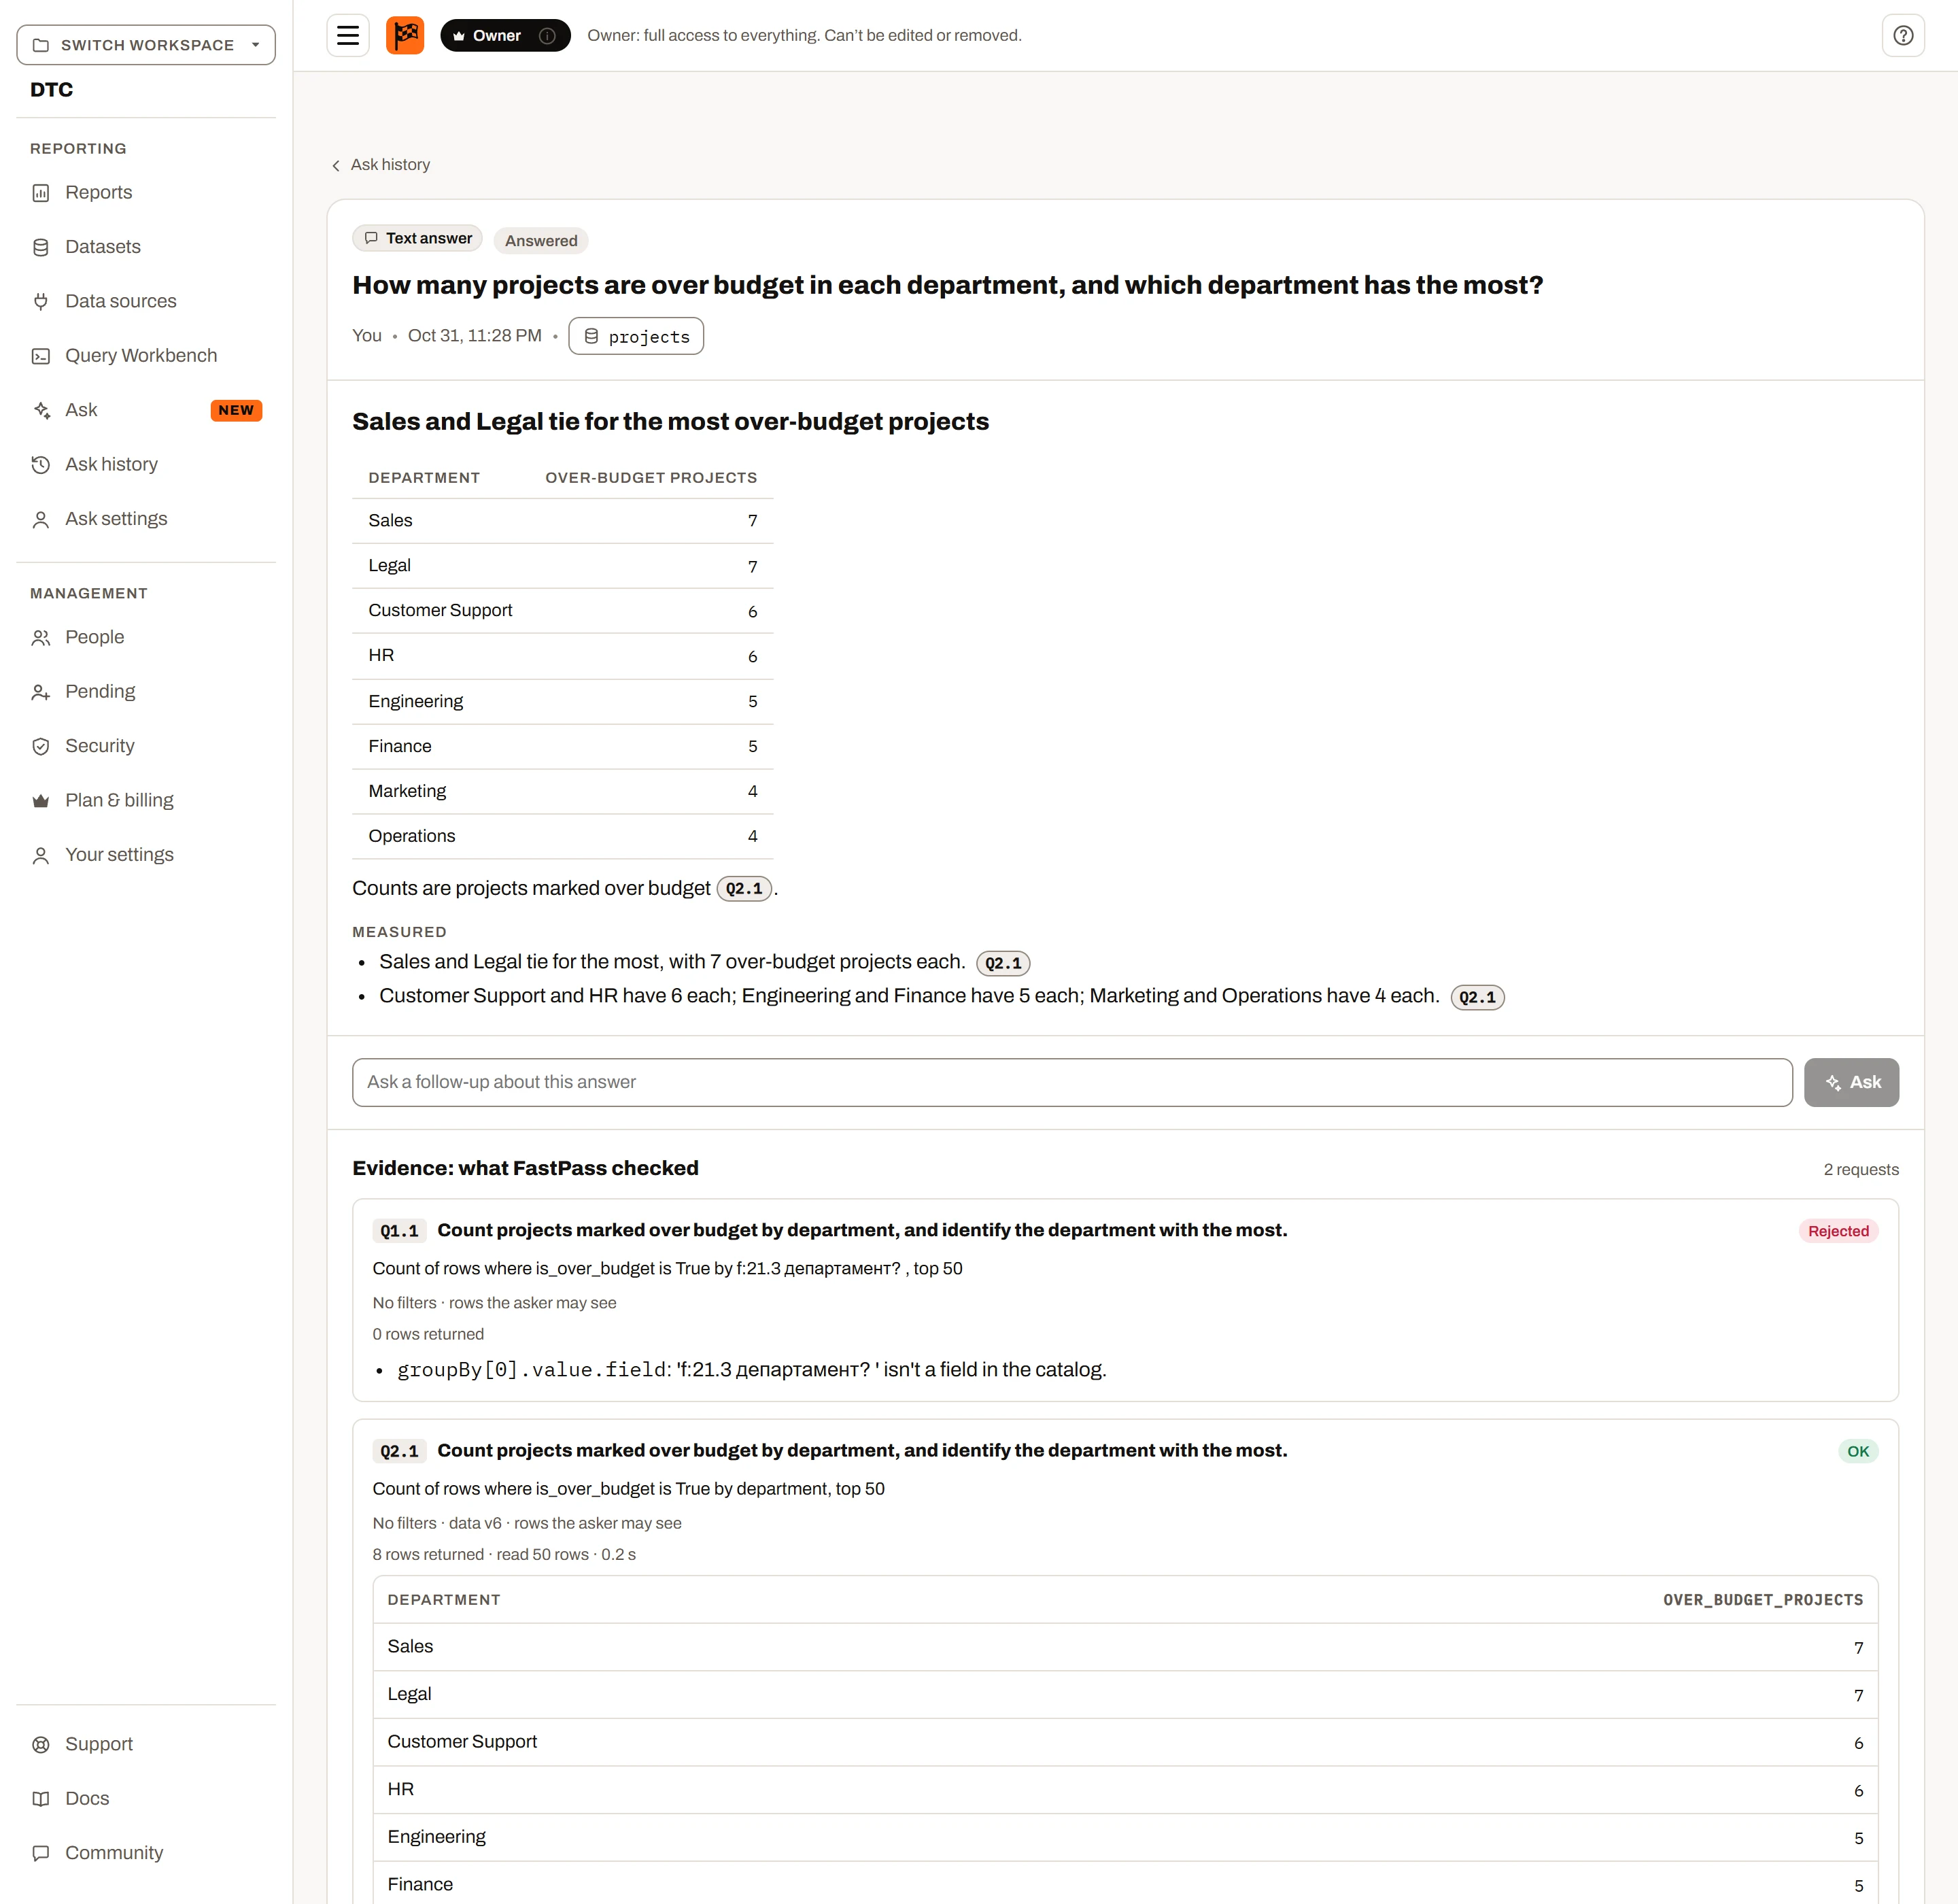
A text answer: the answer with its key numbers, the evidence it used and the follow-ups it offers.
- The answer is formatted text with tables. Figures with a leading + or − are coloured. Each claim cites the request it rests on, such as Q2.1; click one to jump to that request.
- Measured lists findings backed by evidence.
- Hypotheses (investigations) are possible causes FastPass didn't measure, each with what would confirm it. Check them before relying on them.
- Recommendations (data quality) are previews only. Nothing in your data is changed.
- Budget reached means FastPass ran out of checks and answered from what it had found.
Evidence: what FastPass checked#
Every request FastPass made is listed with:
- its purpose, and a plain-words description such as "Sum of UnitPrice × Qty by Customer, top 10, where OrderDate in Q3 2026"
- its status: OK, No matches, Rejected, Timed out or Partial
- its scope (the filters and the data version) and how much it covers ("Top 10 of 1,204 groups · covers 61% of LineValue")
- its result table
- Show query, the query that ran, written in FPQL
- Open in Query Workbench, for people who can use the Query Workbench. The Workbench runs it with your own access, so an admin may see more rows than the person who asked.
Under the list is what was sent: the datasets and their versions, how many columns FastPass could use, which were withheld, whether individual rows were allowed, and the model, rounds and time.
Reports and pages#
When FastPass designs a report or a page, your browser builds it from your data, with your access, and shows it on the result page: the pages as tabs, the charts and tables, and a FastPass summary at the end of the first page, which FastPass writes once it has seen the finished charts. Data as of says when the numbers were taken.
That first view is kept as a snapshot, so the result looks the same whenever you come back, even after the data changes. If you leave the page while it's being built, Insight FastPass finishes it in the background while the app is open and tells you when it's done (and saves it to its folder if you asked for that). If the snapshot wasn't taken yet, it's taken the next time you open the entry. An owner or admin who opens your entry before then sees a live rebuild with their own access, with a note saying so.
Each planned chart is checked against your real data first. One that names a field that doesn't exist, a field that wasn't shared with FastPass, text where a number is needed, or a missing axis is left out, and the list under the report says why.
Suggestions#
Some reports need things your workspace doesn't have yet: a connection between two datasets, a Summary Calculation, or a calculated field. FastPass lists them under the report, with why, and each is checked first:
- A connection's fields must hold the same kind of value, it mustn't already exist, the "one" side must hold each value once, and at least half of the other side's values must be found on it (it starts as Skip with a warning when fewer are).
- A formula must check, and its name must be free.
For each you choose Use in this report, Save for these datasets (connections; needs edit access to both) or Save to the workspace (Summary Calculations), or Skip. Calculated fields live on their dataset, so they offer Save to the dataset or Skip. Skipping a connection also skips the calculations and charts that need it, and a calculation that reads through a connection used only in this report can only be used in this report. Saving a connection from a dataset with row access turned on asks you to confirm, because it changes which rows of the other dataset people see in every report. Saves to the workspace happen when you save the report or add the page.
Saving#
| Action | What it does |
|---|---|
| Save report | Saves the report to a folder you choose, under a name you choose. It reads live data from then on. |
| Save this snapshot as a report | The same, for a report that was never saved. |
| Save another copy | Saves the report again as a new one. |
| Add page to {report} | Adds the page to the report at the position you picked, with the datasets, connections and calculations it needs. Needs edit access to the report; if someone else is editing it, you're told who. |
| Save as its own report | Saves a page as a new report instead. |
| Discard | Marks it Never saved / Never added. It stays in Ask history and can still be saved later. |
| Open saved report / Open in report | Opens what was saved. The result page keeps showing the version FastPass first generated. |
A text answer can become a report or a page too: Turn into a report or Add as a page… asks again with the same question and data, as a new entry.
Explaining a page#
On a saved report, Explain this page sends the page's displayed values (up to 50 per chart), its filters, what its calculations mean and your dataset descriptions to FastPass, and opens the explanation. It says what it explains: "Explains {page} of {report}, filtered to …, data as of …". Ask about this report opens the composer with the report as its source; from a report you can edit, Page in a report is chosen for you. Prompt a report page (on a report you can edit) asks what the page should show, then has FastPass plan that page from the report's data, to go in after the page you're on. Review it and choose Add page.
These buttons show only once an owner or admin has turned Ask FastPass on in Ask settings. They show in the desktop app too: on reports in your live workspace as here, and on an .ifpr file or a library report, where they open an Ask panel and FastPass reads the data on your computer (see Ask FastPass about a report on your computer).
Calculations#
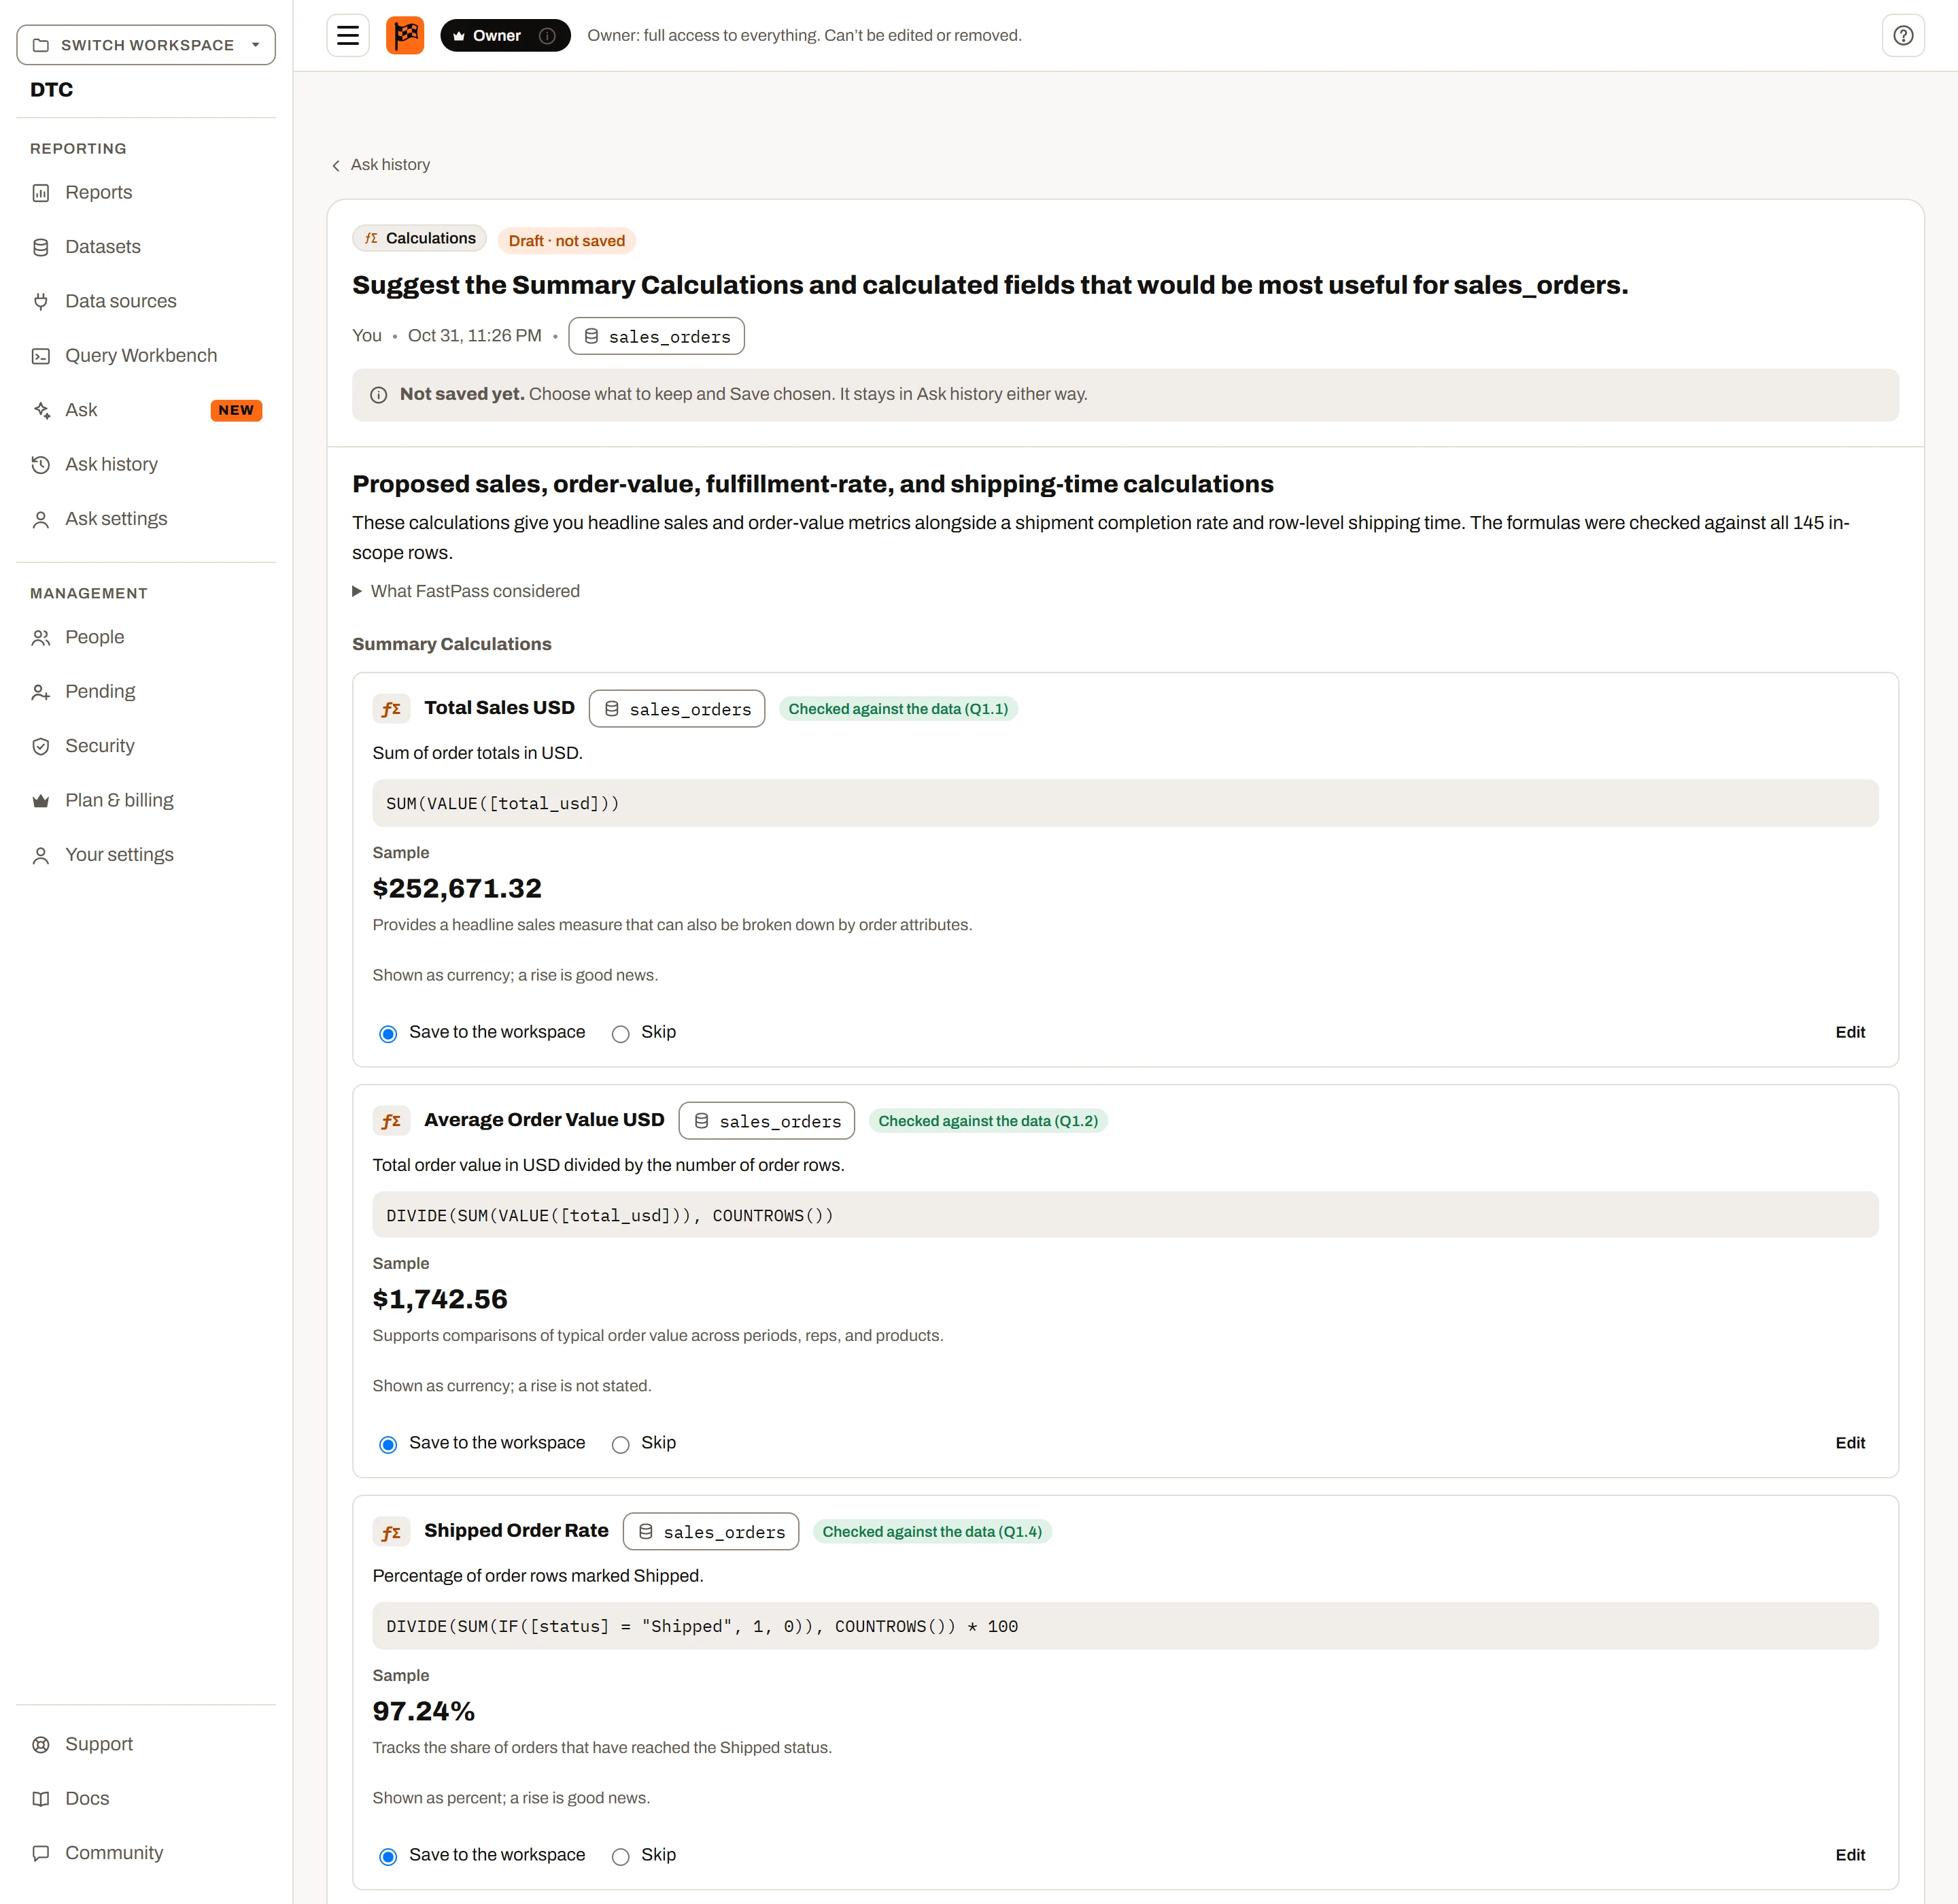
Calculations suggested for a dataset: each one checked against the data, to review and save.
Ask for calculations in plain words: "Add a gross margin % and a flag for discounted lines", or start from Add calculations with FastPass on a dataset's page, or Suggest with FastPass… in the report builder's Data pane (under Summary Calculations).
FastPass writes each formula in the formula language and checks it against your data before it answers: it runs the formula on the rows you can see and looks at what comes back. A formula that doesn't work is corrected or left out. The result shows one card per calculation:
- Summary Calculations (ƒΣ) summarise a dataset's rows, like a total or a ratio. The card shows the total FastPass got, or the top groups for a ranking or running total.
- Calculated fields (ƒ) work out a value on each row. The card shows the first rows with the value and the fields it reads, or, when your workspace doesn't allow row-level results, its most common values.
- Each card says whether it was checked against the data, or checked by the browser only (FastPass didn't run it, but the formula still checks against your datasets and connections), or doesn't check (with the reason; it can't be saved).
- Edit changes the name, formula, description and, for a Summary Calculation, its format and whether a rise is good news. The formula is checked again as you type. The sample stays the one FastPass ran, marked "of the original formula".
- Choose Save to the workspace (a Summary Calculation) or Save to the dataset (a calculated field), or Skip, then Save chosen. Save all that check chooses every card that can be saved and saves them. Saving needs edit access to every dataset a calculation reads.
- When a calculation reads another dataset that isn't connected yet, FastPass suggests the connection above the cards. Save it for its datasets, or skip it and the calculations that need it.
- Your filters shape the samples, but a saved calculation has no filter of its own.
Saved calculations are in the workspace straight away: Import… in a report's Data pane lists the Summary Calculations, and calculated fields appear on their dataset. The entry shows Saved in Ask history, or Never saved after 7 days. Discard only labels it; you can still save later.
Queries#
Ask for a query: "List customers with no order in the last 90 days", "Monthly totals of sales by region". From the Query Workbench, Ask FastPass on the toolbar opens the composer with the datasets you have open or selected. A query is asked on datasets, so it isn't offered from a report, on the website or in the desktop app.
FastPass builds the query from the same checked requests it uses for any question, so it reads only along your connections and only what you may see. It never writes free text. It runs the query once, and the result shows:
- the query's name, what it returns, and the assumptions it made (a field it chose between, a period it assumed);
- the query, coloured as the Workbench colours it. A query built in steps saves each step into a temporary table first (
SELECT … INTO #step), then reads it; - what it gave when FastPass ran it. FastPass works within a limit of 50 rows; the query itself has no such limit unless you asked for a number of rows.
When the query is ready, it opens in the Query Workbench by itself, in a tab named after the query: on the website in place of the answer, and in the desktop app in a window of its own. The answer stays in Ask history, and Open in Query Workbench on it opens the query again (in a new tab on the website). Save to My queries saves it to your folder in the Workbench, and Ask history shows Saved as a query. Copy query copies the text. Turn into a report asks again for a report on the same question. Some requests go past what FastPass can build (a union, or a join that isn't one of your connections); the answer says so and gives the closest query, for you to finish in the Workbench.
A text answer can also become a query or calculations: Write this as a query and Turn into calculations ask again with the same question and data. An answer about a report has no Write this as a query.
On data on your computer (the desktop app), the Ask panel over the report adds calculations to it with Add to this report (see Ask FastPass about a report on your computer). Here, in Ask history, such an insight offers Copy formula only.
Checking data quality#
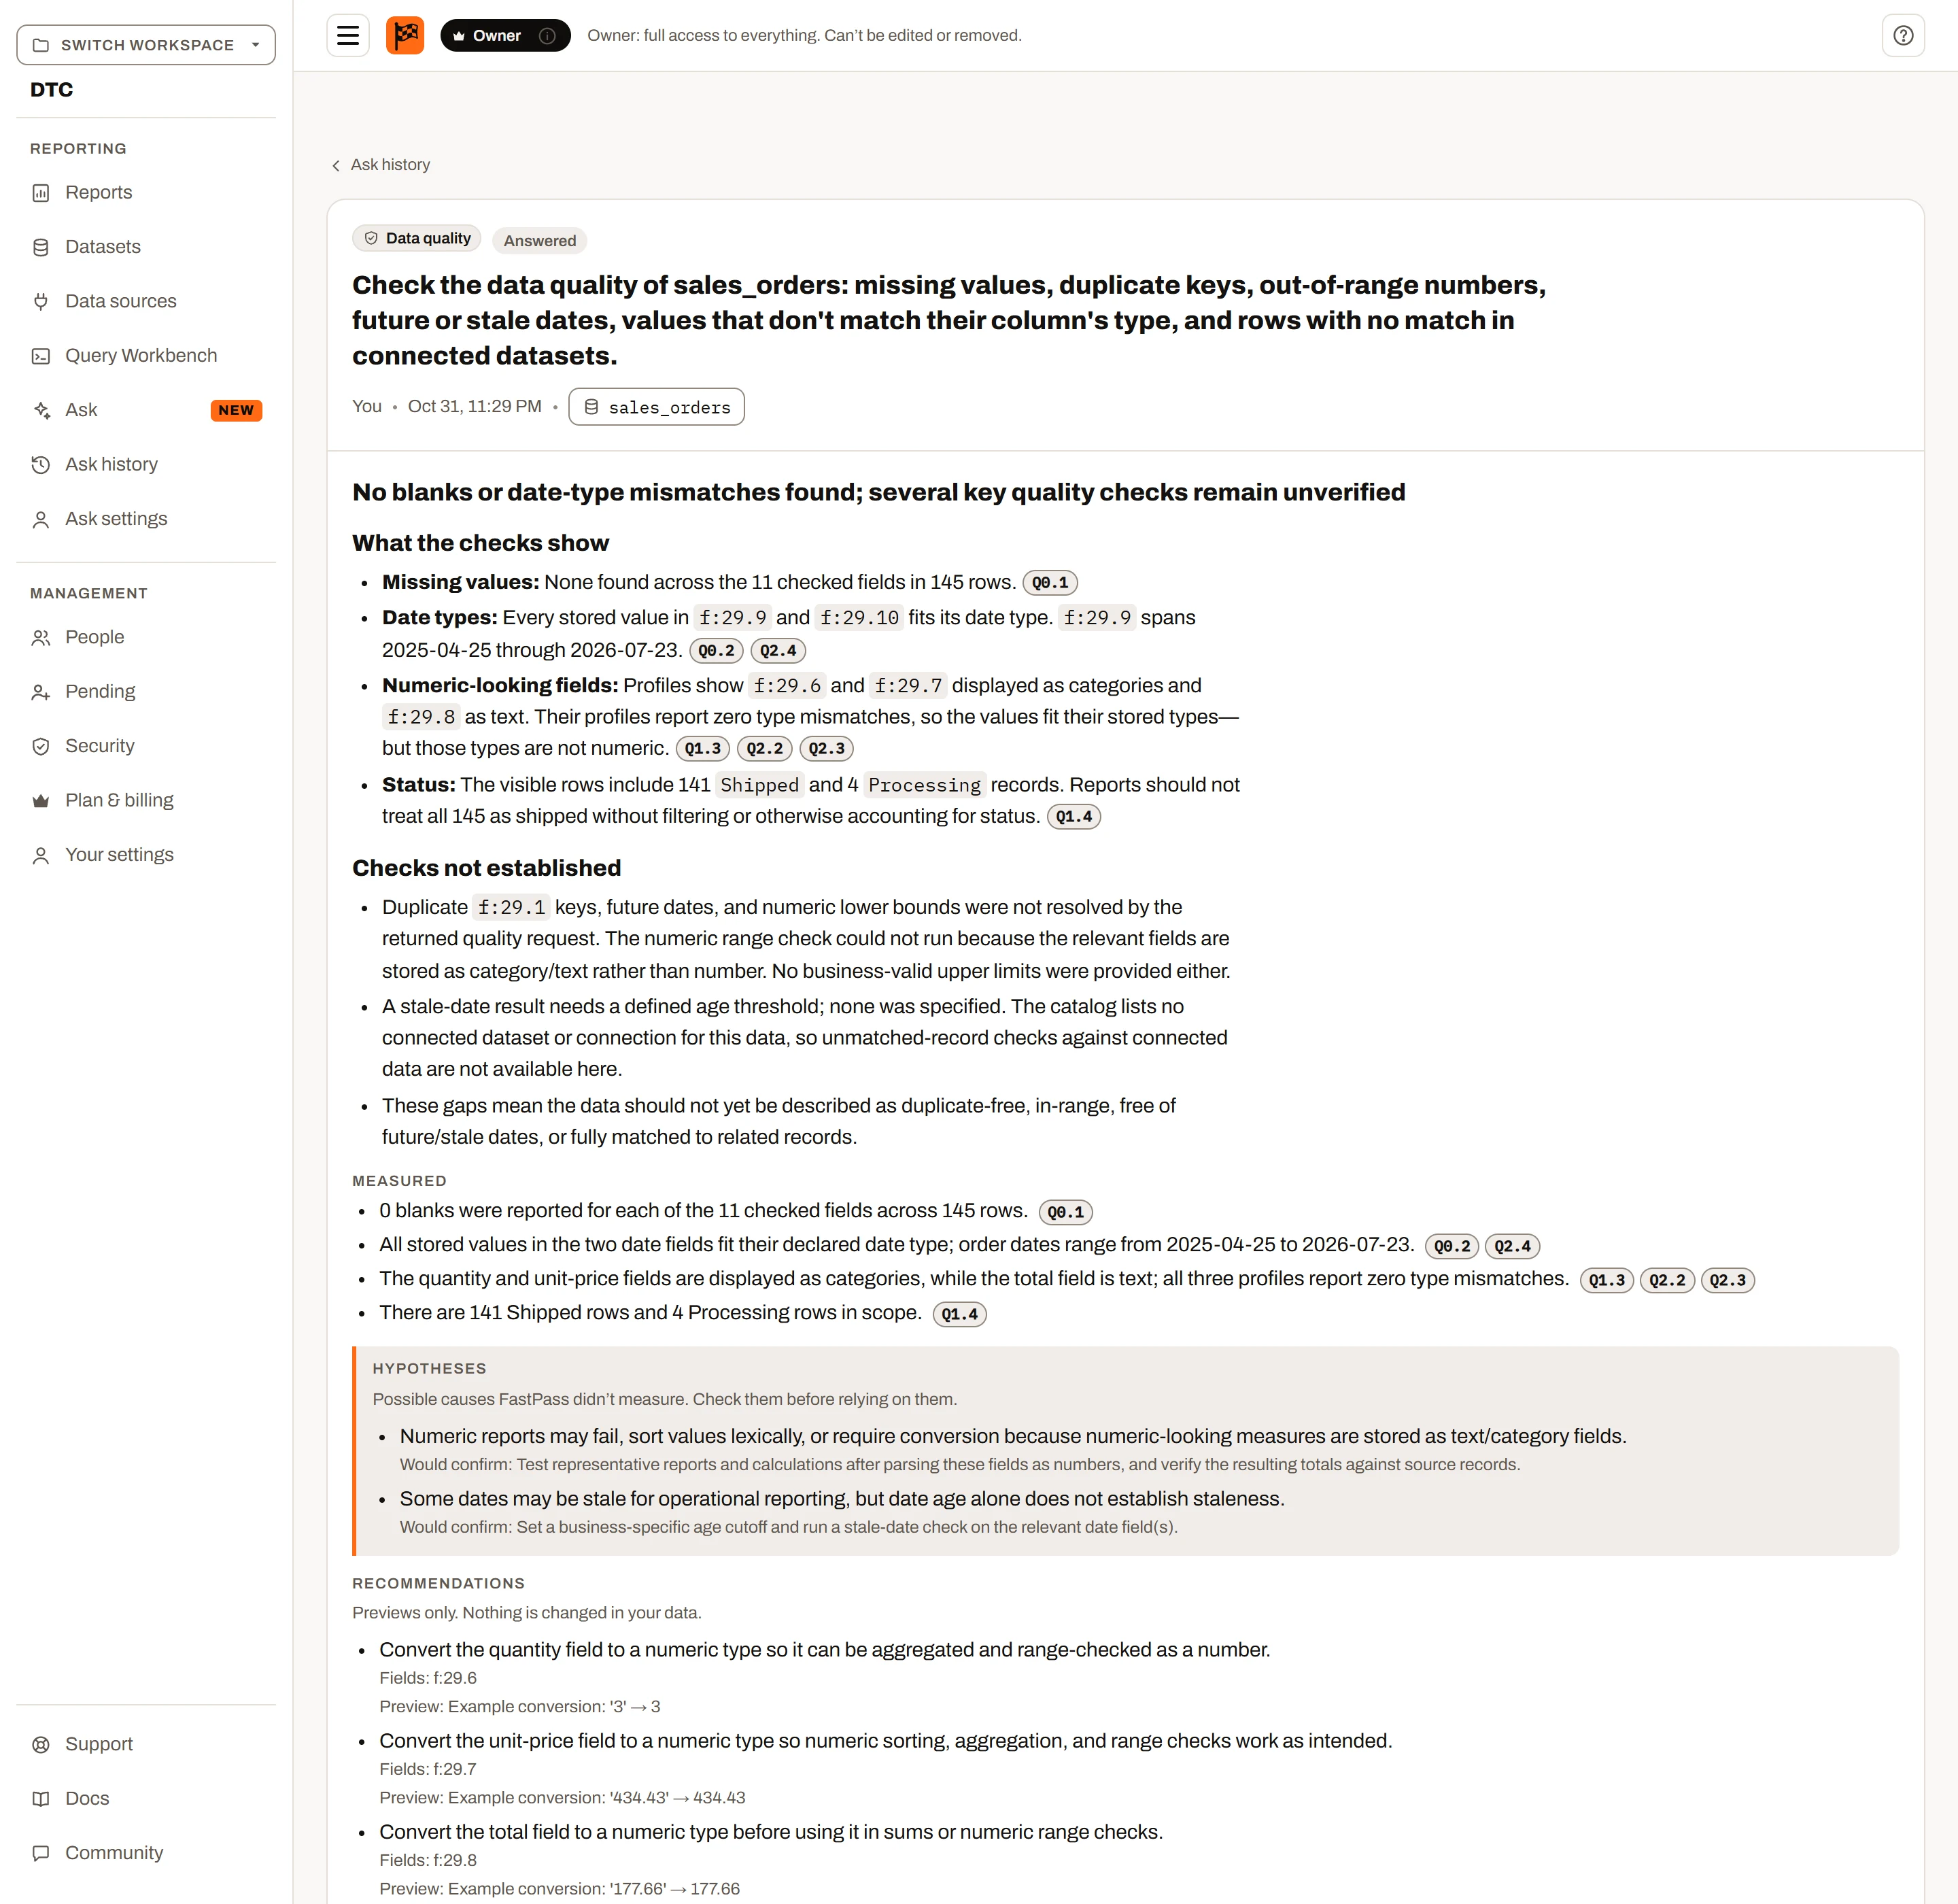
A data quality check: what it found in the dataset, the evidence, and the cleanups it recommends.
On a dataset's page, Check data quality with FastPass asks FastPass to look for missing values, duplicate keys, numbers out of range, future or stale dates, values that don't match their column's type and rows with no match in connected datasets. The answer lists what it found, with evidence, and recommends cleanups. It never changes your data.
Actions#
| Action | What it does |
|---|---|
| Copy answer | Copies the answer as Markdown. |
| Download .md | Downloads the answer with the question, sources, filters and an Evidence appendix. |
| Edit request | Opens the composer with this question and data, to change and ask again. |
| Re-run on current data | Asks the same question again on today's data, as a new entry. |
| Ask a follow-up | Asks a new question that knows the answer before it. |
Ask history#
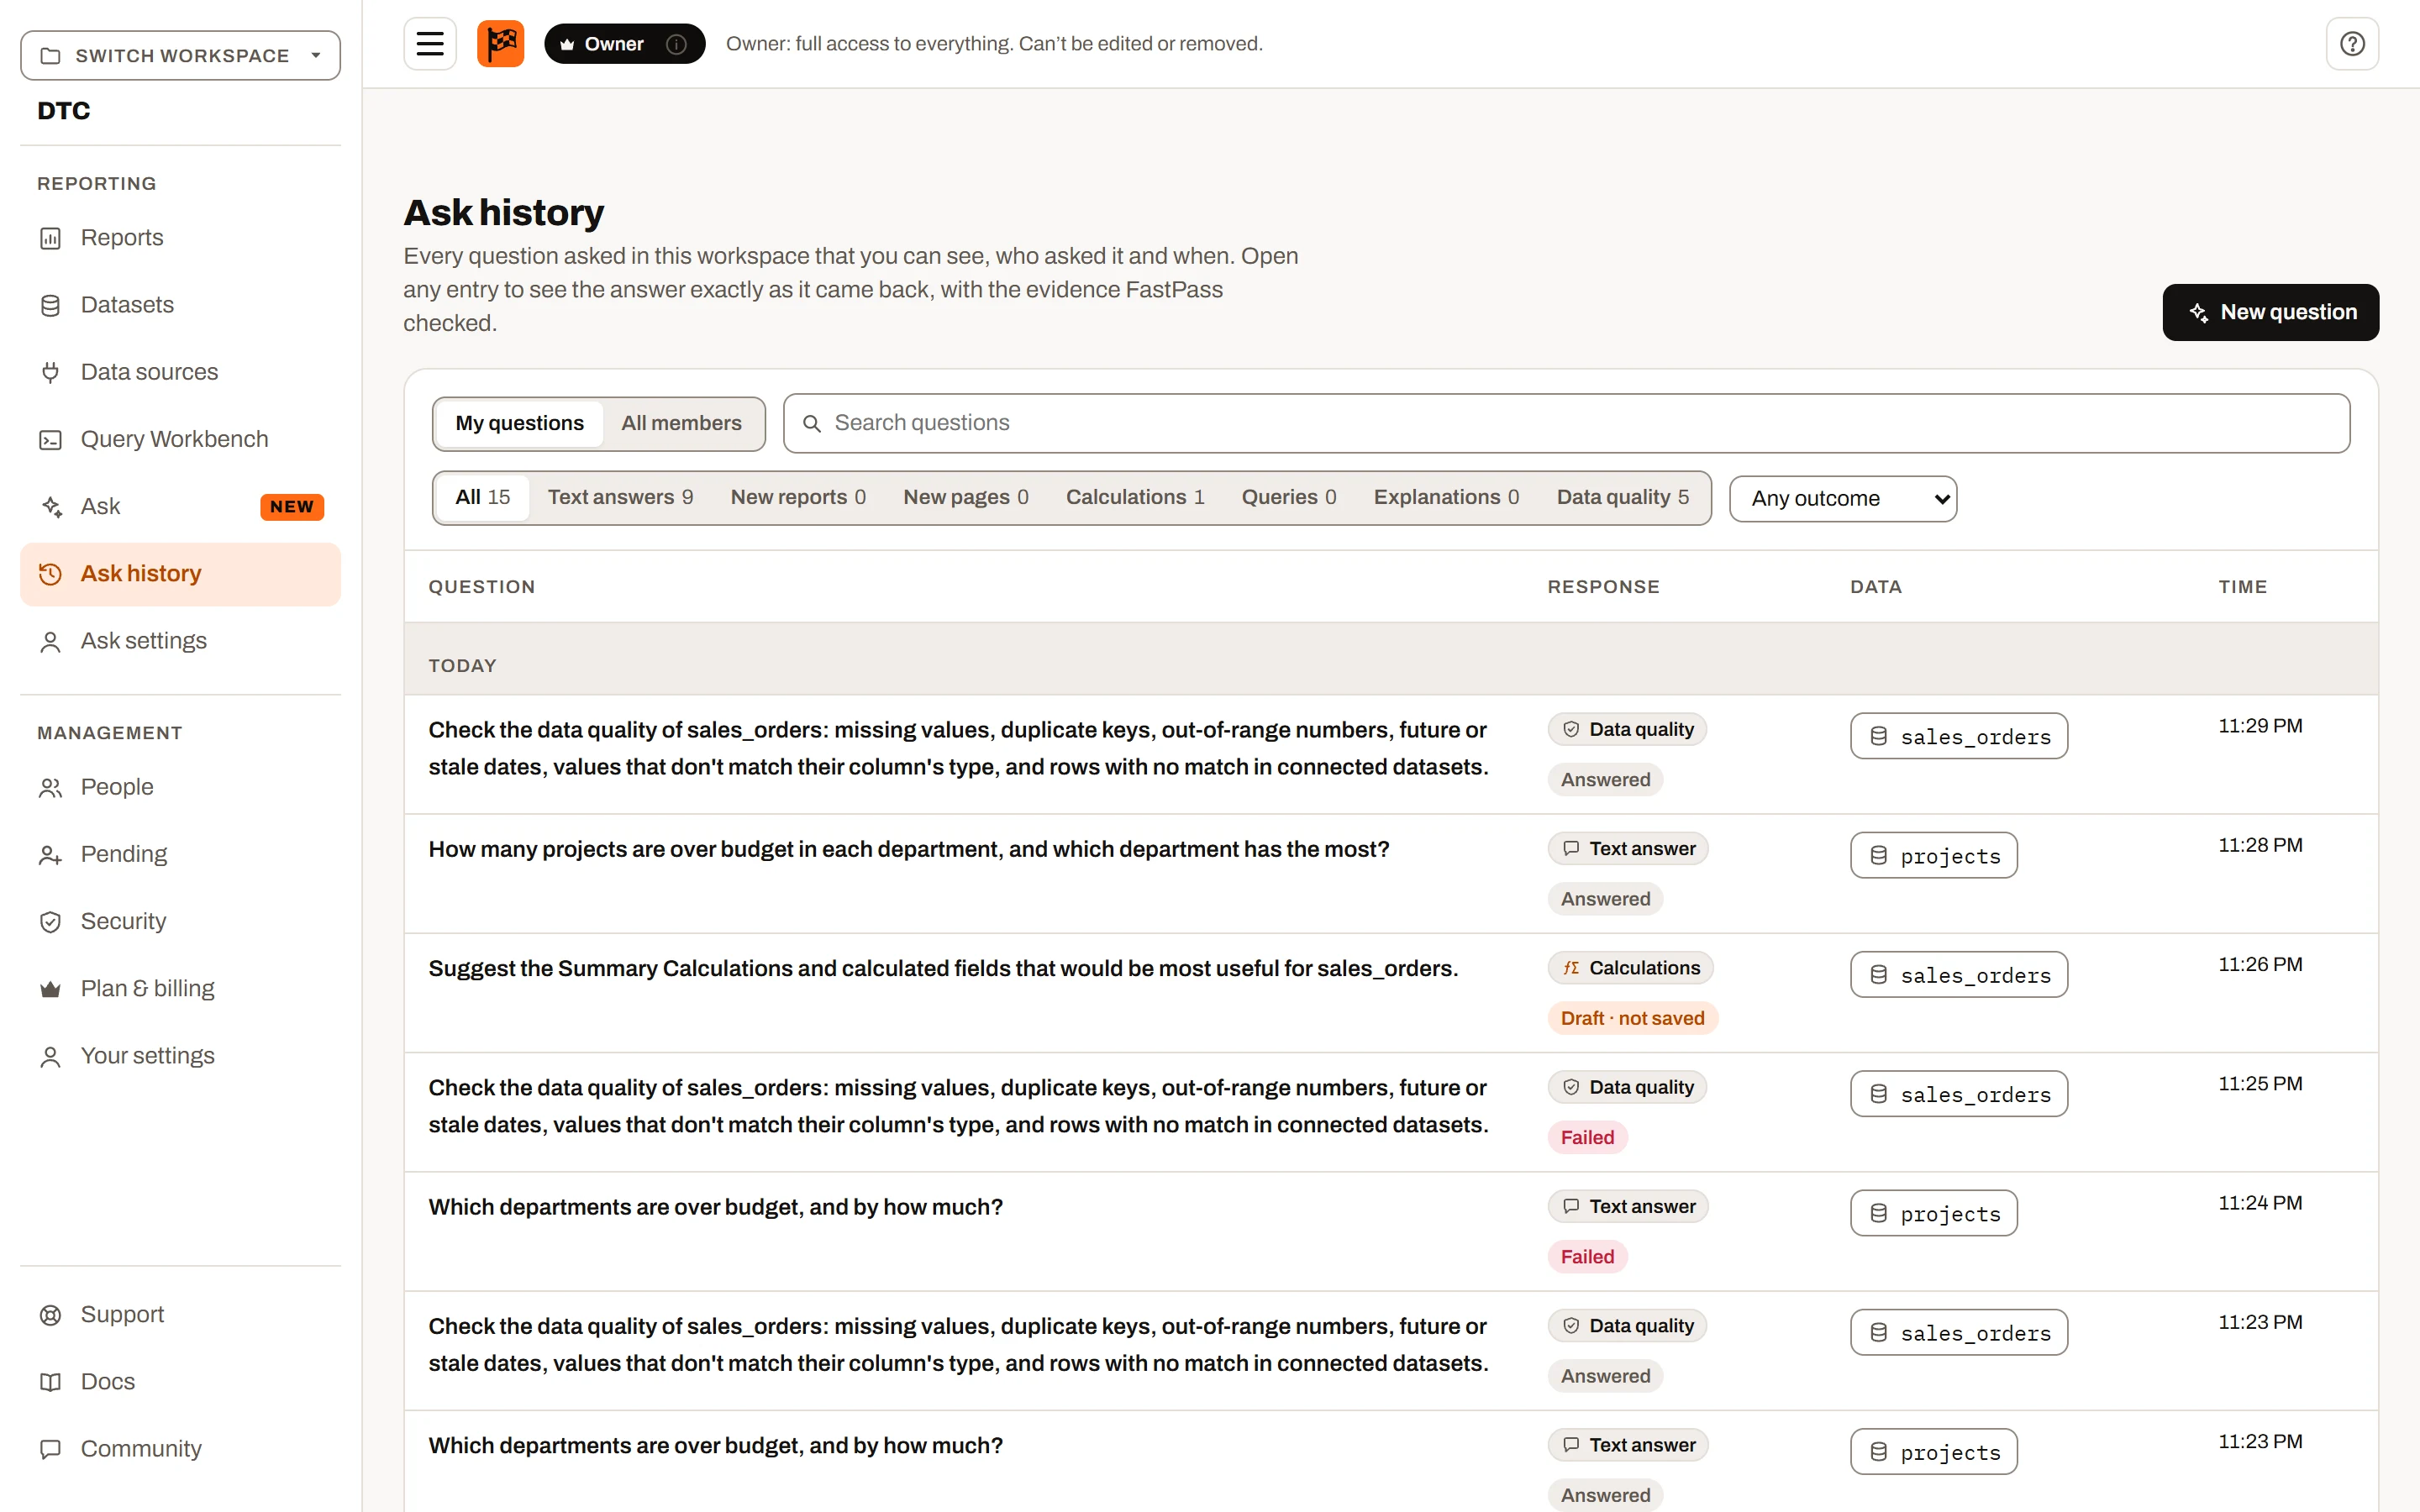
Ask history.
Ask history lists every question you can see, newest first, grouped by day, a month at a time (Show the previous month at the bottom). Search, and filter by type and outcome. Open any entry to see the answer exactly as it came back, with its evidence.
- Members see their own questions. The owner and admins see everyone's, with All members and an Asked by filter. Someone who has left shows as Former member.
- Entries can't be deleted by members or admins. They are kept for as long as the workspace exists. Support removes a person's entries only to meet a legal request, with two support staff signing off; the month then shows a line saying how many entries were removed, without saying whose.
- A report or page FastPass built that was never saved shows as Never saved or Never added after 7 days. It can still be opened.
Describing your data#
FastPass reads your datasets' descriptions before it asks for any data. Good descriptions are the best way to get good answers: they tell it which field is the right one, what unit a number is in, and what would mislead a total.
To write one, choose Describe for Ask FastPass from the dataset's ⋯ menu on the Datasets page, or from Actions on the dataset's own page (you need edit access to the dataset). The item shows while Ask FastPass is on, and reads Edit Ask description once a description is written (View Ask description for someone without edit access). There are three parts:
| Part | Write | Example |
|---|---|---|
| What one row represents | The grain: what a single row is. | One row per invoice line |
| Fields | For each field that matters, what it means and its unit. Calculated fields can be described too. | Amount: "Net of discounts, before tax", unit USD |
| Rules a reader needs | How refunds, cancellations, duplicates and partial periods show up, and test or internal rows to ignore. | Refunds are negative lines with Type = 'Refund'. October 2026 is a partial month. |
Tips:
- Say what a field counts, not its name again. "Close date" says nothing; "The day the deal was won or lost; blank while open" says a lot.
- Give units for every money, time and percentage field: USD, days, %.
- Name the field to use when two look alike: "Use NetAmount for revenue; GrossAmount includes tax".
- Mention partial periods and known gaps, so FastPass doesn't report a drop that is really missing data.
- Keep it short. A line per field is enough.
Where a field has no description, FastPass is told so, and asks you when the difference matters. Ask settings lists the datasets nobody has described yet.
Ask settings#
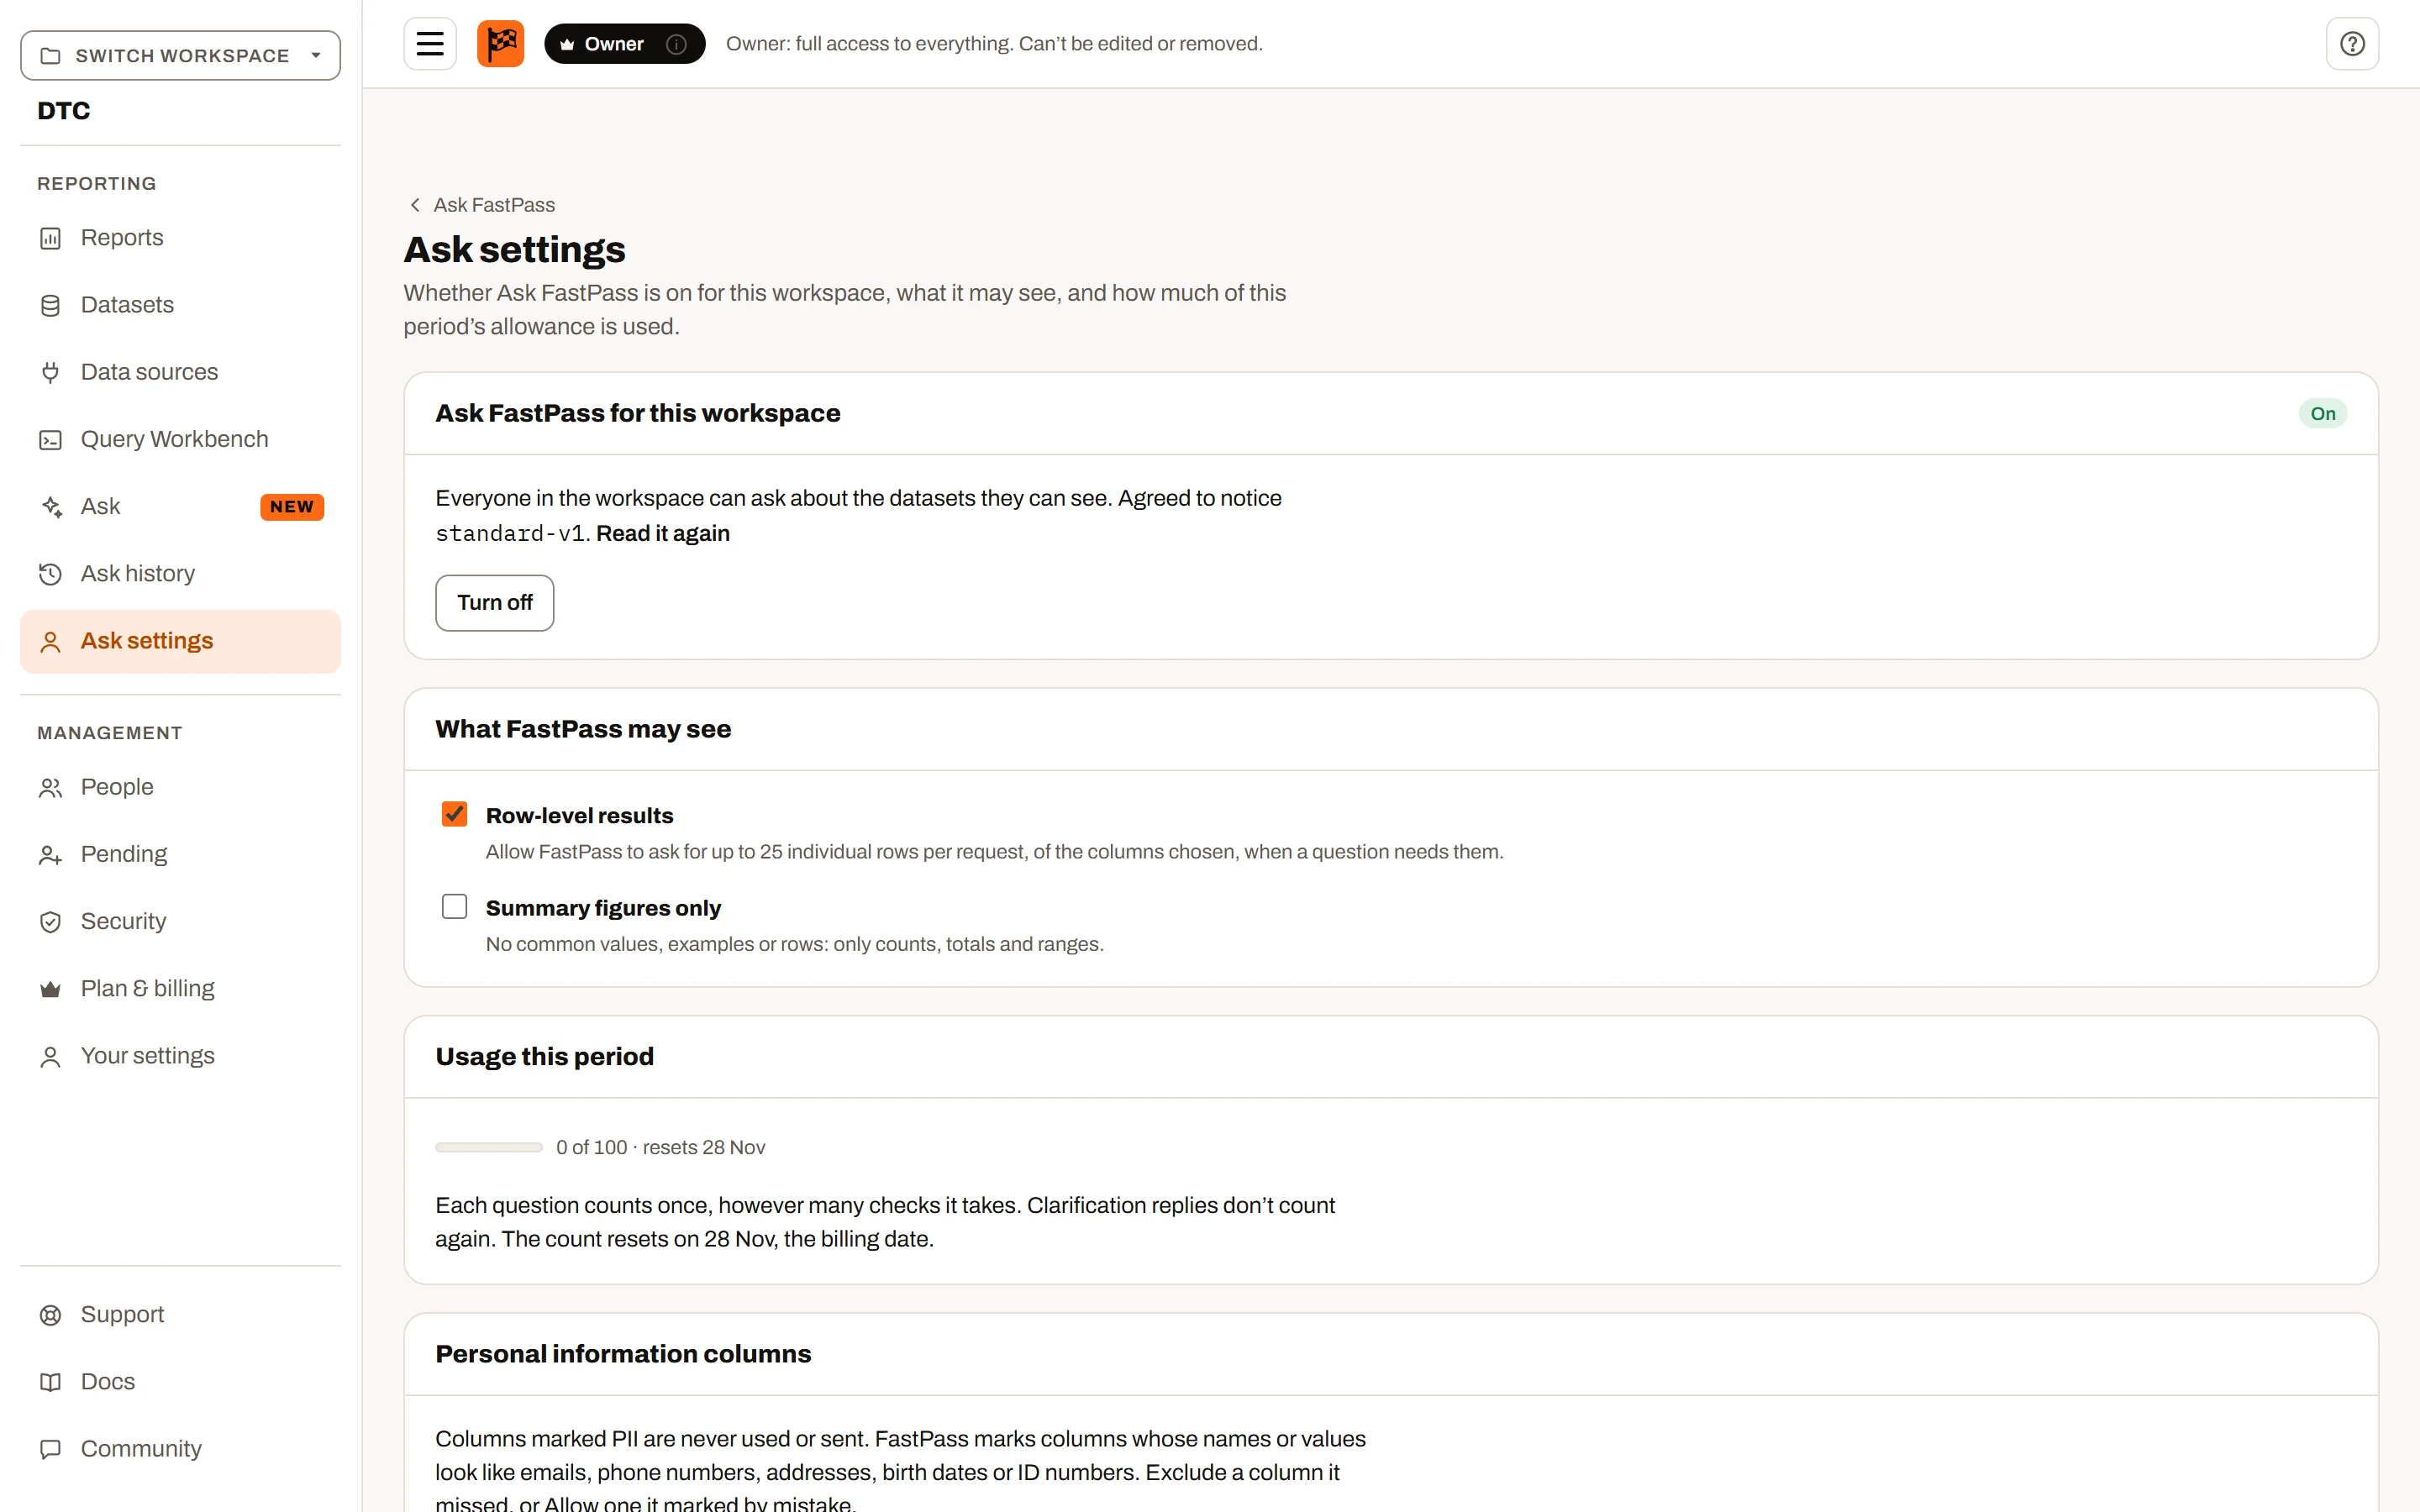
Ask settings.
Owners and admins open Ask settings from the Ask page.
- On / off, with the notice.
- Row-level results: whether FastPass may ask for up to 25 individual rows per request. Off, it works from totals only.
- Summary figures only: no common values, examples or rows, only counts, totals and ranges.
- Usage this period and the reset date. Each question counts once, however many checks it takes.
- Personal information columns: per dataset, the columns marked PII. Exclude marks a column FastPass missed; Allow clears one it marked by mistake. Excluded columns are never used or sent.
- Datasets without a description, with links to describe them.
What is sent, and what is kept#
- Sent to OpenAI: the question, a description of the chosen data (names, types, your descriptions, summary figures), the results of the requests FastPass makes (at most 50 rows of totals per request, and up to 25 individual rows if allowed), and a few shortened example values when FastPass needs to understand a column. Whole datasets, PII columns and unticked columns are never sent. Insight FastPass asks OpenAI not to store requests; OpenAI may still keep them for up to 30 days in abuse-monitoring logs. The notice in Ask settings has the details.
- Kept in Ask history: who asked and when, the question, the data and filters chosen, the description sent, every request FastPass made with the results it was sent, and the answer.
Answers can be wrong or incomplete. Check the evidence before acting on an answer.